Chippewa vs Lithuanian Child Poverty Among Girls Under 16
COMPARE
Chippewa
Lithuanian
Child Poverty Among Girls Under 16
Child Poverty Among Girls Under 16 Comparison
Chippewa
Lithuanians
20.6%
CHILD POVERTY AMONG GIRLS UNDER 16
0.0/ 100
METRIC RATING
291st/ 347
METRIC RANK
13.9%
CHILD POVERTY AMONG GIRLS UNDER 16
99.6/ 100
METRIC RATING
37th/ 347
METRIC RANK
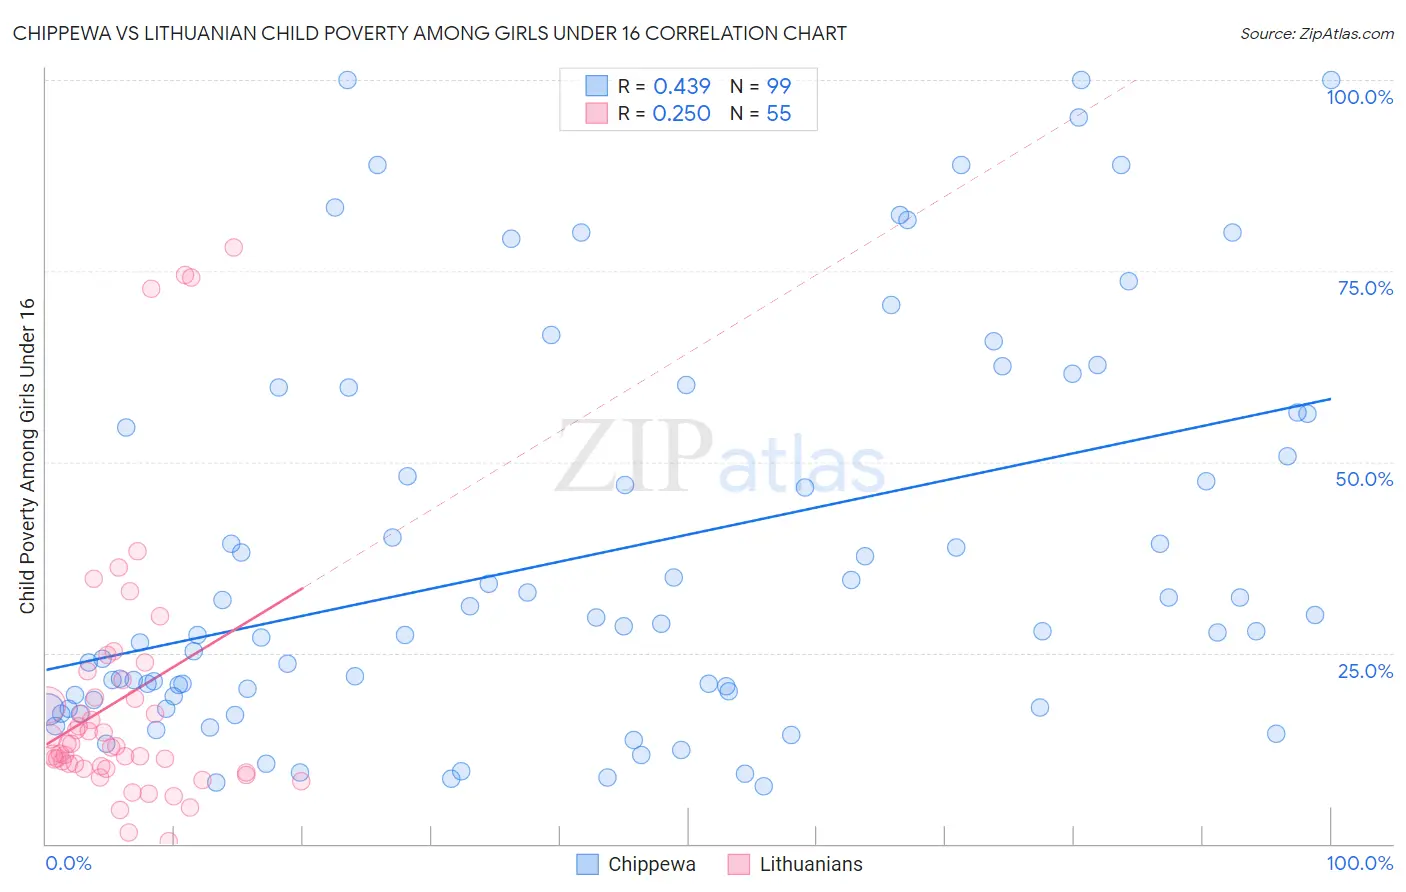
Chippewa vs Lithuanian Child Poverty Among Girls Under 16 Correlation Chart
The statistical analysis conducted on geographies consisting of 212,813,465 people shows a moderate positive correlation between the proportion of Chippewa and poverty level among girls under the age of 16 in the United States with a correlation coefficient (R) of 0.439 and weighted average of 20.6%. Similarly, the statistical analysis conducted on geographies consisting of 410,552,780 people shows a weak positive correlation between the proportion of Lithuanians and poverty level among girls under the age of 16 in the United States with a correlation coefficient (R) of 0.250 and weighted average of 13.9%, a difference of 48.8%.
Child Poverty Among Girls Under 16 Correlation Summary
| Measurement | Chippewa | Lithuanian |
| Minimum | 7.5% | 0.39% |
| Maximum | 100.0% | 78.0% |
| Range | 92.5% | 77.7% |
| Mean | 37.7% | 19.1% |
| Median | 27.8% | 12.8% |
| Interquartile 25% (IQ1) | 18.9% | 9.9% |
| Interquartile 75% (IQ3) | 56.3% | 21.5% |
| Interquartile Range (IQR) | 37.5% | 11.6% |
| Standard Deviation (Sample) | 25.5% | 17.8% |
| Standard Deviation (Population) | 25.4% | 17.6% |
Similar Demographics by Child Poverty Among Girls Under 16
Demographics Similar to Chippewa by Child Poverty Among Girls Under 16
In terms of child poverty among girls under 16, the demographic groups most similar to Chippewa are Immigrants from Latin America (20.6%, a difference of 0.070%), Immigrants from Grenada (20.7%, a difference of 0.11%), Immigrants from Haiti (20.6%, a difference of 0.13%), Immigrants from Belize (20.6%, a difference of 0.20%), and Immigrants from Senegal (20.7%, a difference of 0.22%).
| Demographics | Rating | Rank | Child Poverty Among Girls Under 16 |
| Yaqui | 0.0 /100 | #284 | Tragic 20.3% |
| Immigrants | Cabo Verde | 0.0 /100 | #285 | Tragic 20.3% |
| Iroquois | 0.0 /100 | #286 | Tragic 20.4% |
| Blackfeet | 0.0 /100 | #287 | Tragic 20.5% |
| Haitians | 0.0 /100 | #288 | Tragic 20.5% |
| Immigrants | Belize | 0.0 /100 | #289 | Tragic 20.6% |
| Immigrants | Haiti | 0.0 /100 | #290 | Tragic 20.6% |
| Chippewa | 0.0 /100 | #291 | Tragic 20.6% |
| Immigrants | Latin America | 0.0 /100 | #292 | Tragic 20.6% |
| Immigrants | Grenada | 0.0 /100 | #293 | Tragic 20.7% |
| Immigrants | Senegal | 0.0 /100 | #294 | Tragic 20.7% |
| Immigrants | Caribbean | 0.0 /100 | #295 | Tragic 20.7% |
| Immigrants | West Indies | 0.0 /100 | #296 | Tragic 20.7% |
| Inupiat | 0.0 /100 | #297 | Tragic 20.8% |
| Mexicans | 0.0 /100 | #298 | Tragic 20.9% |
Demographics Similar to Lithuanians by Child Poverty Among Girls Under 16
In terms of child poverty among girls under 16, the demographic groups most similar to Lithuanians are Russian (13.9%, a difference of 0.020%), Immigrants from Northern Europe (13.8%, a difference of 0.17%), Immigrants from Moldova (13.9%, a difference of 0.30%), Immigrants from Australia (14.0%, a difference of 0.95%), and Immigrants from Sri Lanka (14.0%, a difference of 1.0%).
| Demographics | Rating | Rank | Child Poverty Among Girls Under 16 |
| Asians | 99.7 /100 | #30 | Exceptional 13.7% |
| Turks | 99.7 /100 | #31 | Exceptional 13.7% |
| Danes | 99.7 /100 | #32 | Exceptional 13.7% |
| Swedes | 99.7 /100 | #33 | Exceptional 13.7% |
| Maltese | 99.7 /100 | #34 | Exceptional 13.7% |
| Immigrants | Northern Europe | 99.6 /100 | #35 | Exceptional 13.8% |
| Russians | 99.6 /100 | #36 | Exceptional 13.9% |
| Lithuanians | 99.6 /100 | #37 | Exceptional 13.9% |
| Immigrants | Moldova | 99.6 /100 | #38 | Exceptional 13.9% |
| Immigrants | Australia | 99.5 /100 | #39 | Exceptional 14.0% |
| Immigrants | Sri Lanka | 99.5 /100 | #40 | Exceptional 14.0% |
| Immigrants | Bolivia | 99.5 /100 | #41 | Exceptional 14.0% |
| Immigrants | Scotland | 99.4 /100 | #42 | Exceptional 14.0% |
| Koreans | 99.4 /100 | #43 | Exceptional 14.1% |
| Immigrants | Asia | 99.4 /100 | #44 | Exceptional 14.1% |