Chippewa vs Asian Single Male Poverty
COMPARE
Chippewa
Asian
Single Male Poverty
Single Male Poverty Comparison
Chippewa
Asians
16.4%
SINGLE MALE POVERTY
0.0/ 100
METRIC RATING
319th/ 347
METRIC RANK
11.2%
SINGLE MALE POVERTY
100.0/ 100
METRIC RATING
21st/ 347
METRIC RANK
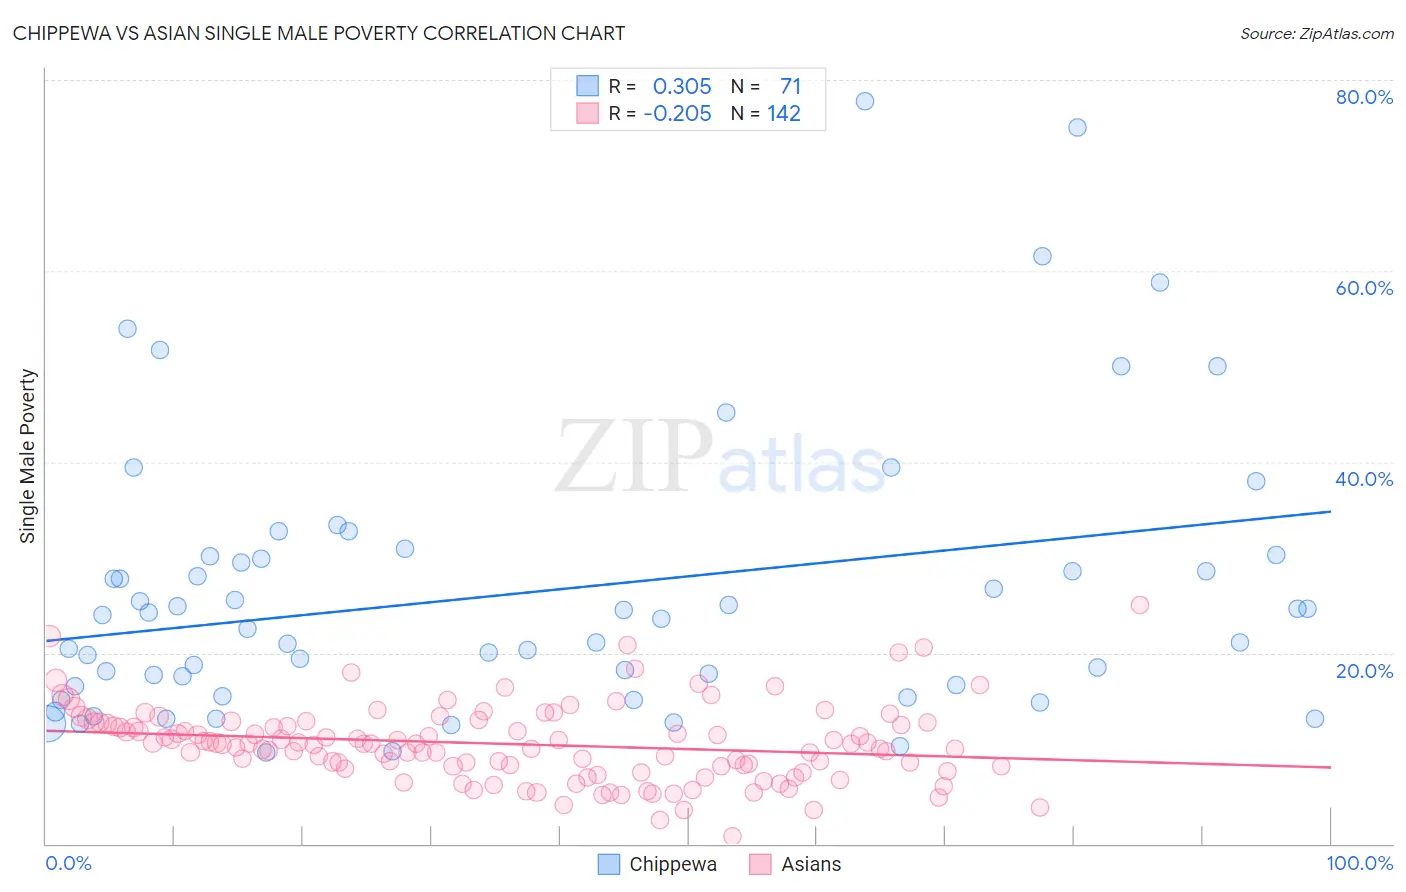
Chippewa vs Asian Single Male Poverty Correlation Chart
The statistical analysis conducted on geographies consisting of 198,626,002 people shows a mild positive correlation between the proportion of Chippewa and poverty level among single males in the United States with a correlation coefficient (R) of 0.305 and weighted average of 16.4%. Similarly, the statistical analysis conducted on geographies consisting of 462,594,480 people shows a weak negative correlation between the proportion of Asians and poverty level among single males in the United States with a correlation coefficient (R) of -0.205 and weighted average of 11.2%, a difference of 46.1%.
Single Male Poverty Correlation Summary
| Measurement | Chippewa | Asian |
| Minimum | 9.5% | 0.83% |
| Maximum | 77.8% | 25.0% |
| Range | 68.3% | 24.2% |
| Mean | 26.4% | 10.5% |
| Median | 23.6% | 10.5% |
| Interquartile 25% (IQ1) | 16.5% | 8.1% |
| Interquartile 75% (IQ3) | 30.2% | 12.7% |
| Interquartile Range (IQR) | 13.7% | 4.6% |
| Standard Deviation (Sample) | 14.6% | 4.0% |
| Standard Deviation (Population) | 14.5% | 4.0% |
Similar Demographics by Single Male Poverty
Demographics Similar to Chippewa by Single Male Poverty
In terms of single male poverty, the demographic groups most similar to Chippewa are Chickasaw (16.3%, a difference of 0.30%), Marshallese (16.4%, a difference of 0.48%), Osage (16.5%, a difference of 0.61%), Black/African American (16.2%, a difference of 1.1%), and Dutch West Indian (16.1%, a difference of 1.5%).
| Demographics | Rating | Rank | Single Male Poverty |
| Comanche | 0.0 /100 | #312 | Tragic 16.0% |
| Cherokee | 0.0 /100 | #313 | Tragic 16.1% |
| Alaskan Athabascans | 0.0 /100 | #314 | Tragic 16.1% |
| Cheyenne | 0.0 /100 | #315 | Tragic 16.1% |
| Dutch West Indians | 0.0 /100 | #316 | Tragic 16.1% |
| Blacks/African Americans | 0.0 /100 | #317 | Tragic 16.2% |
| Chickasaw | 0.0 /100 | #318 | Tragic 16.3% |
| Chippewa | 0.0 /100 | #319 | Tragic 16.4% |
| Marshallese | 0.0 /100 | #320 | Tragic 16.4% |
| Osage | 0.0 /100 | #321 | Tragic 16.5% |
| Shoshone | 0.0 /100 | #322 | Tragic 16.7% |
| Creek | 0.0 /100 | #323 | Tragic 16.8% |
| Immigrants | Yemen | 0.0 /100 | #324 | Tragic 16.9% |
| Choctaw | 0.0 /100 | #325 | Tragic 17.0% |
| Central American Indians | 0.0 /100 | #326 | Tragic 17.2% |
Demographics Similar to Asians by Single Male Poverty
In terms of single male poverty, the demographic groups most similar to Asians are Immigrants from Pakistan (11.2%, a difference of 0.090%), Bolivian (11.2%, a difference of 0.30%), Ethiopian (11.2%, a difference of 0.34%), Immigrants from Moldova (11.2%, a difference of 0.37%), and Indian (Asian) (11.3%, a difference of 0.50%).
| Demographics | Rating | Rank | Single Male Poverty |
| Chinese | 100.0 /100 | #14 | Exceptional 11.0% |
| Koreans | 100.0 /100 | #15 | Exceptional 11.0% |
| Bhutanese | 100.0 /100 | #16 | Exceptional 11.1% |
| Tsimshian | 100.0 /100 | #17 | Exceptional 11.1% |
| Immigrants | Bolivia | 100.0 /100 | #18 | Exceptional 11.1% |
| Immigrants | Moldova | 100.0 /100 | #19 | Exceptional 11.2% |
| Ethiopians | 100.0 /100 | #20 | Exceptional 11.2% |
| Asians | 100.0 /100 | #21 | Exceptional 11.2% |
| Immigrants | Pakistan | 100.0 /100 | #22 | Exceptional 11.2% |
| Bolivians | 100.0 /100 | #23 | Exceptional 11.2% |
| Indians (Asian) | 100.0 /100 | #24 | Exceptional 11.3% |
| Maltese | 100.0 /100 | #25 | Exceptional 11.3% |
| Immigrants | Japan | 100.0 /100 | #26 | Exceptional 11.3% |
| Immigrants | China | 100.0 /100 | #27 | Exceptional 11.4% |
| Immigrants | Asia | 100.0 /100 | #28 | Exceptional 11.4% |