Honduran vs Cherokee Child Poverty Among Girls Under 16
COMPARE
Honduran
Cherokee
Child Poverty Among Girls Under 16
Child Poverty Among Girls Under 16 Comparison
Hondurans
Cherokee
22.2%
CHILD POVERTY AMONG GIRLS UNDER 16
0.0/ 100
METRIC RATING
320th/ 347
METRIC RANK
19.9%
CHILD POVERTY AMONG GIRLS UNDER 16
0.1/ 100
METRIC RATING
270th/ 347
METRIC RANK
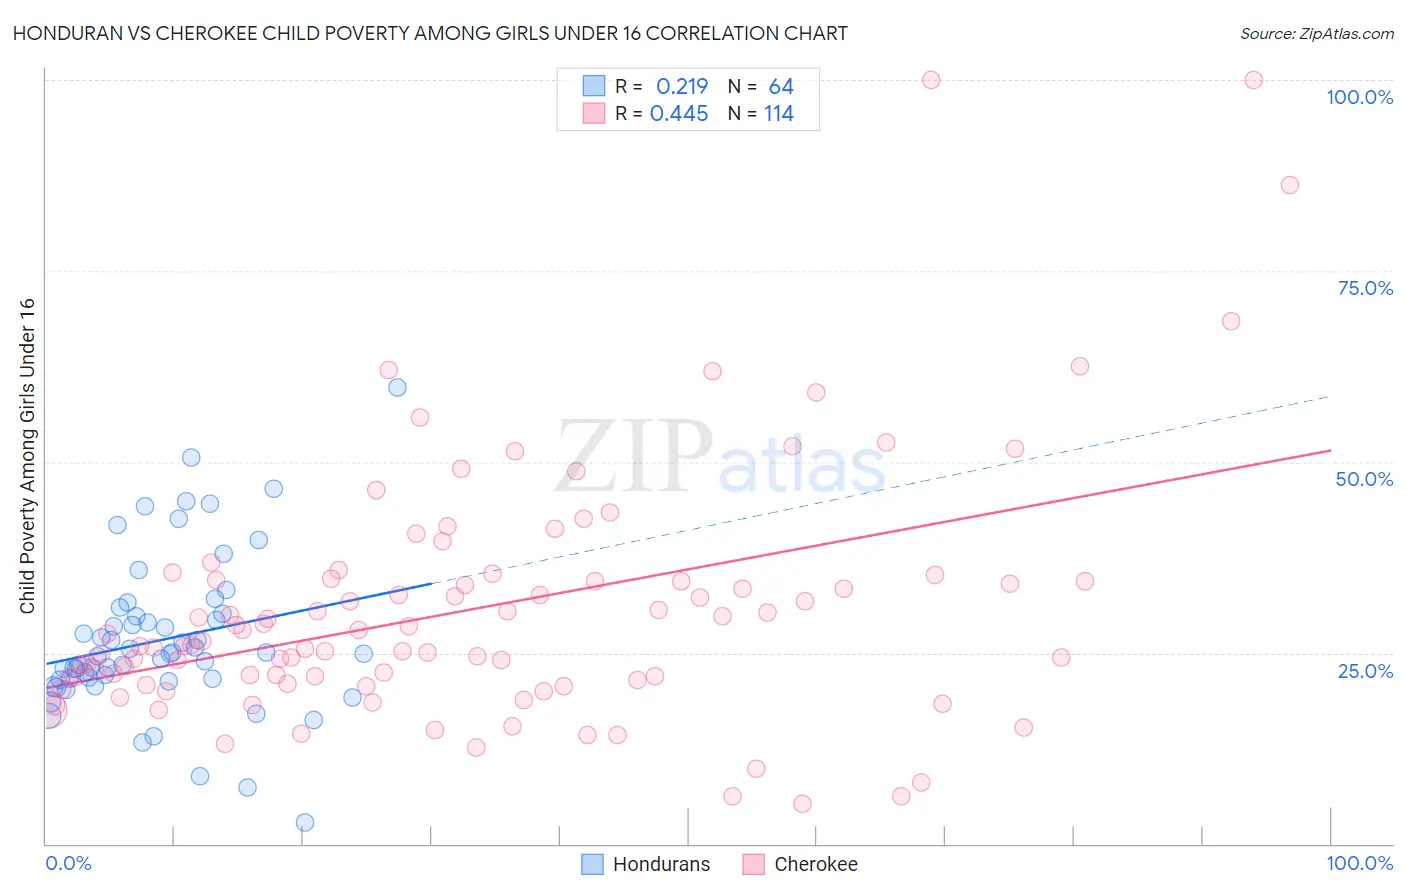
Honduran vs Cherokee Child Poverty Among Girls Under 16 Correlation Chart
The statistical analysis conducted on geographies consisting of 354,249,736 people shows a weak positive correlation between the proportion of Hondurans and poverty level among girls under the age of 16 in the United States with a correlation coefficient (R) of 0.219 and weighted average of 22.2%. Similarly, the statistical analysis conducted on geographies consisting of 483,336,049 people shows a moderate positive correlation between the proportion of Cherokee and poverty level among girls under the age of 16 in the United States with a correlation coefficient (R) of 0.445 and weighted average of 19.9%, a difference of 11.7%.
Child Poverty Among Girls Under 16 Correlation Summary
| Measurement | Honduran | Cherokee |
| Minimum | 2.8% | 5.3% |
| Maximum | 59.7% | 100.0% |
| Range | 56.9% | 94.7% |
| Mean | 26.7% | 30.7% |
| Median | 24.9% | 26.2% |
| Interquartile 25% (IQ1) | 21.5% | 21.4% |
| Interquartile 75% (IQ3) | 30.0% | 34.5% |
| Interquartile Range (IQR) | 8.4% | 13.1% |
| Standard Deviation (Sample) | 10.2% | 16.5% |
| Standard Deviation (Population) | 10.1% | 16.4% |
Similar Demographics by Child Poverty Among Girls Under 16
Demographics Similar to Hondurans by Child Poverty Among Girls Under 16
In terms of child poverty among girls under 16, the demographic groups most similar to Hondurans are U.S. Virgin Islander (22.1%, a difference of 0.60%), Immigrants from Dominica (22.1%, a difference of 0.76%), Colville (22.5%, a difference of 1.3%), African (21.9%, a difference of 1.4%), and Yakama (22.6%, a difference of 1.5%).
| Demographics | Rating | Rank | Child Poverty Among Girls Under 16 |
| Creek | 0.0 /100 | #313 | Tragic 21.7% |
| Arapaho | 0.0 /100 | #314 | Tragic 21.7% |
| Ute | 0.0 /100 | #315 | Tragic 21.8% |
| Immigrants | Guatemala | 0.0 /100 | #316 | Tragic 21.9% |
| Africans | 0.0 /100 | #317 | Tragic 21.9% |
| Immigrants | Dominica | 0.0 /100 | #318 | Tragic 22.1% |
| U.S. Virgin Islanders | 0.0 /100 | #319 | Tragic 22.1% |
| Hondurans | 0.0 /100 | #320 | Tragic 22.2% |
| Colville | 0.0 /100 | #321 | Tragic 22.5% |
| Yakama | 0.0 /100 | #322 | Tragic 22.6% |
| Cajuns | 0.0 /100 | #323 | Tragic 22.6% |
| Paiute | 0.0 /100 | #324 | Tragic 22.6% |
| Immigrants | Congo | 0.0 /100 | #325 | Tragic 22.7% |
| Immigrants | Honduras | 0.0 /100 | #326 | Tragic 22.8% |
| Central American Indians | 0.0 /100 | #327 | Tragic 22.8% |
Demographics Similar to Cherokee by Child Poverty Among Girls Under 16
In terms of child poverty among girls under 16, the demographic groups most similar to Cherokee are Immigrants from Barbados (19.9%, a difference of 0.10%), Liberian (19.9%, a difference of 0.18%), Immigrants from El Salvador (20.0%, a difference of 0.21%), Spanish American Indian (19.9%, a difference of 0.28%), and Immigrants from Bangladesh (19.9%, a difference of 0.32%).
| Demographics | Rating | Rank | Child Poverty Among Girls Under 16 |
| Immigrants | Burma/Myanmar | 0.1 /100 | #263 | Tragic 19.7% |
| Jamaicans | 0.1 /100 | #264 | Tragic 19.7% |
| Immigrants | Jamaica | 0.1 /100 | #265 | Tragic 19.8% |
| Spanish Americans | 0.1 /100 | #266 | Tragic 19.8% |
| Immigrants | Bangladesh | 0.1 /100 | #267 | Tragic 19.9% |
| Spanish American Indians | 0.1 /100 | #268 | Tragic 19.9% |
| Liberians | 0.1 /100 | #269 | Tragic 19.9% |
| Cherokee | 0.1 /100 | #270 | Tragic 19.9% |
| Immigrants | Barbados | 0.1 /100 | #271 | Tragic 19.9% |
| Immigrants | El Salvador | 0.1 /100 | #272 | Tragic 20.0% |
| Bangladeshis | 0.1 /100 | #273 | Tragic 20.0% |
| Immigrants | St. Vincent and the Grenadines | 0.0 /100 | #274 | Tragic 20.1% |
| Sub-Saharan Africans | 0.0 /100 | #275 | Tragic 20.1% |
| Comanche | 0.0 /100 | #276 | Tragic 20.2% |
| Belizeans | 0.0 /100 | #277 | Tragic 20.2% |