Chickasaw vs Scandinavian Single Father Poverty
COMPARE
Chickasaw
Scandinavian
Single Father Poverty
Single Father Poverty Comparison
Chickasaw
Scandinavians
19.0%
SINGLE FATHER POVERTY
0.0/ 100
METRIC RATING
315th/ 347
METRIC RANK
16.3%
SINGLE FATHER POVERTY
52.3/ 100
METRIC RATING
170th/ 347
METRIC RANK
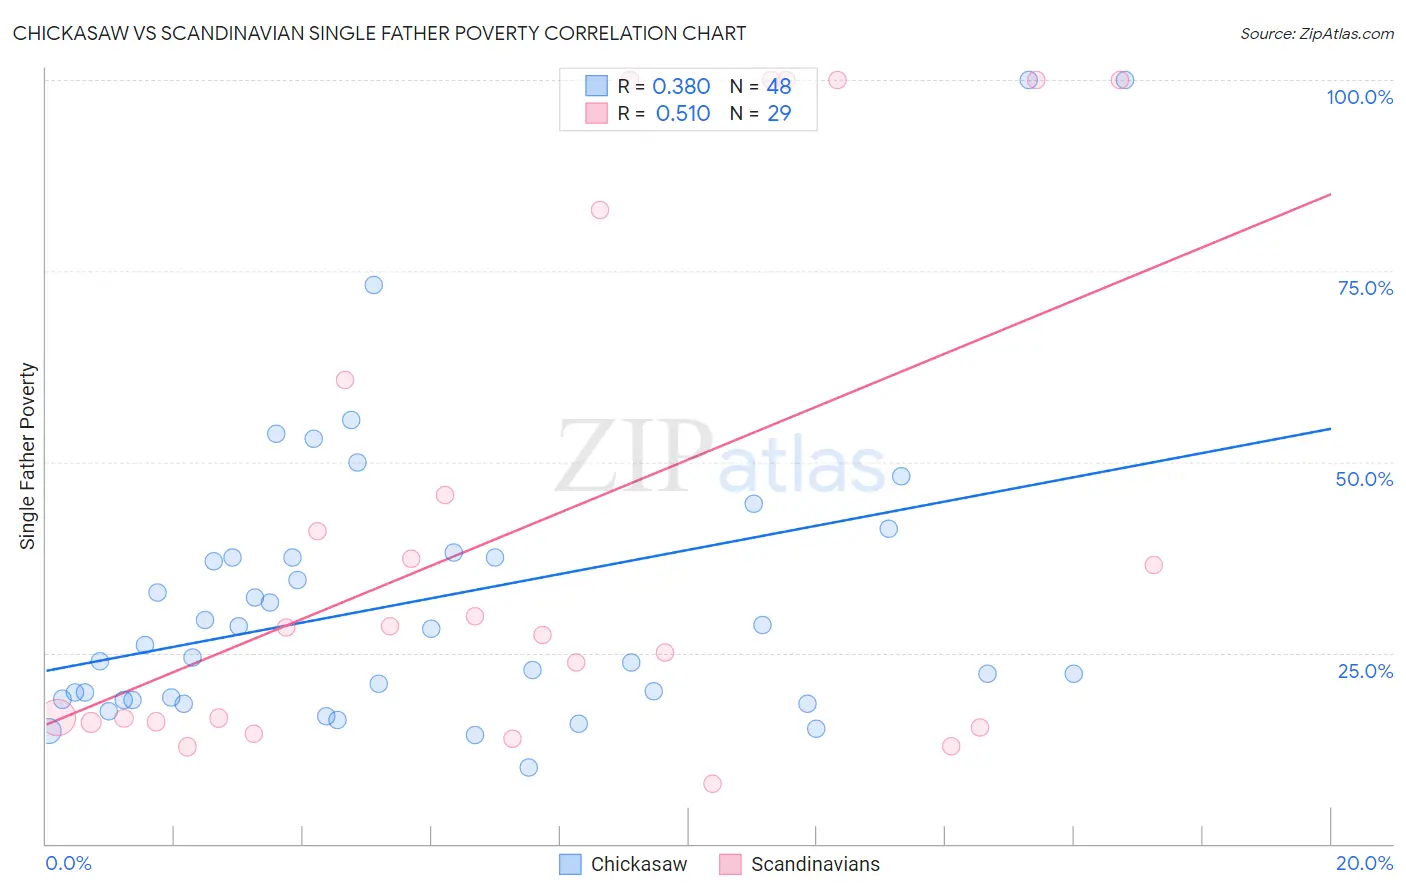
Chickasaw vs Scandinavian Single Father Poverty Correlation Chart
The statistical analysis conducted on geographies consisting of 131,493,414 people shows a mild positive correlation between the proportion of Chickasaw and poverty level among single fathers in the United States with a correlation coefficient (R) of 0.380 and weighted average of 19.0%. Similarly, the statistical analysis conducted on geographies consisting of 353,551,665 people shows a substantial positive correlation between the proportion of Scandinavians and poverty level among single fathers in the United States with a correlation coefficient (R) of 0.510 and weighted average of 16.3%, a difference of 16.4%.
Single Father Poverty Correlation Summary
| Measurement | Chickasaw | Scandinavian |
| Minimum | 10.0% | 7.8% |
| Maximum | 100.0% | 100.0% |
| Range | 90.0% | 92.2% |
| Mean | 31.9% | 42.2% |
| Median | 25.2% | 28.3% |
| Interquartile 25% (IQ1) | 18.9% | 15.9% |
| Interquartile 75% (IQ3) | 37.5% | 71.8% |
| Interquartile Range (IQR) | 18.6% | 55.9% |
| Standard Deviation (Sample) | 19.5% | 33.9% |
| Standard Deviation (Population) | 19.3% | 33.3% |
Similar Demographics by Single Father Poverty
Demographics Similar to Chickasaw by Single Father Poverty
In terms of single father poverty, the demographic groups most similar to Chickasaw are Delaware (18.9%, a difference of 0.16%), Potawatomi (18.9%, a difference of 0.32%), Osage (19.0%, a difference of 0.40%), Immigrants from Dominica (18.9%, a difference of 0.52%), and Nonimmigrants (18.8%, a difference of 0.57%).
| Demographics | Rating | Rank | Single Father Poverty |
| Ottawa | 0.0 /100 | #308 | Tragic 18.6% |
| Immigrants | Micronesia | 0.0 /100 | #309 | Tragic 18.6% |
| Chippewa | 0.0 /100 | #310 | Tragic 18.8% |
| Immigrants | Nonimmigrants | 0.0 /100 | #311 | Tragic 18.8% |
| Immigrants | Dominica | 0.0 /100 | #312 | Tragic 18.9% |
| Potawatomi | 0.0 /100 | #313 | Tragic 18.9% |
| Delaware | 0.0 /100 | #314 | Tragic 18.9% |
| Chickasaw | 0.0 /100 | #315 | Tragic 19.0% |
| Osage | 0.0 /100 | #316 | Tragic 19.0% |
| Dominicans | 0.0 /100 | #317 | Tragic 19.1% |
| Dutch West Indians | 0.0 /100 | #318 | Tragic 19.2% |
| Slovaks | 0.0 /100 | #319 | Tragic 19.3% |
| Inupiat | 0.0 /100 | #320 | Tragic 19.5% |
| Cherokee | 0.0 /100 | #321 | Tragic 19.6% |
| Creek | 0.0 /100 | #322 | Tragic 19.8% |
Demographics Similar to Scandinavians by Single Father Poverty
In terms of single father poverty, the demographic groups most similar to Scandinavians are Northern European (16.3%, a difference of 0.020%), Costa Rican (16.3%, a difference of 0.060%), Yugoslavian (16.3%, a difference of 0.070%), Immigrants from Morocco (16.3%, a difference of 0.070%), and Immigrants from Sierra Leone (16.3%, a difference of 0.10%).
| Demographics | Rating | Rank | Single Father Poverty |
| Immigrants | Costa Rica | 55.7 /100 | #163 | Average 16.3% |
| Guyanese | 55.2 /100 | #164 | Average 16.3% |
| Immigrants | Bangladesh | 55.1 /100 | #165 | Average 16.3% |
| Immigrants | Europe | 54.8 /100 | #166 | Average 16.3% |
| Yugoslavians | 53.9 /100 | #167 | Average 16.3% |
| Costa Ricans | 53.6 /100 | #168 | Average 16.3% |
| Northern Europeans | 52.8 /100 | #169 | Average 16.3% |
| Scandinavians | 52.3 /100 | #170 | Average 16.3% |
| Immigrants | Morocco | 50.7 /100 | #171 | Average 16.3% |
| Immigrants | Sierra Leone | 50.1 /100 | #172 | Average 16.3% |
| Immigrants | St. Vincent and the Grenadines | 50.0 /100 | #173 | Average 16.3% |
| Swedes | 50.0 /100 | #174 | Average 16.3% |
| Immigrants | Ecuador | 49.7 /100 | #175 | Average 16.3% |
| Vietnamese | 48.0 /100 | #176 | Average 16.3% |
| Immigrants | South Africa | 44.2 /100 | #177 | Average 16.3% |