Immigrants from Austria vs Scandinavian Single Father Poverty
COMPARE
Immigrants from Austria
Scandinavian
Single Father Poverty
Single Father Poverty Comparison
Immigrants from Austria
Scandinavians
16.8%
SINGLE FATHER POVERTY
7.0/ 100
METRIC RATING
223rd/ 347
METRIC RANK
16.3%
SINGLE FATHER POVERTY
52.3/ 100
METRIC RATING
170th/ 347
METRIC RANK
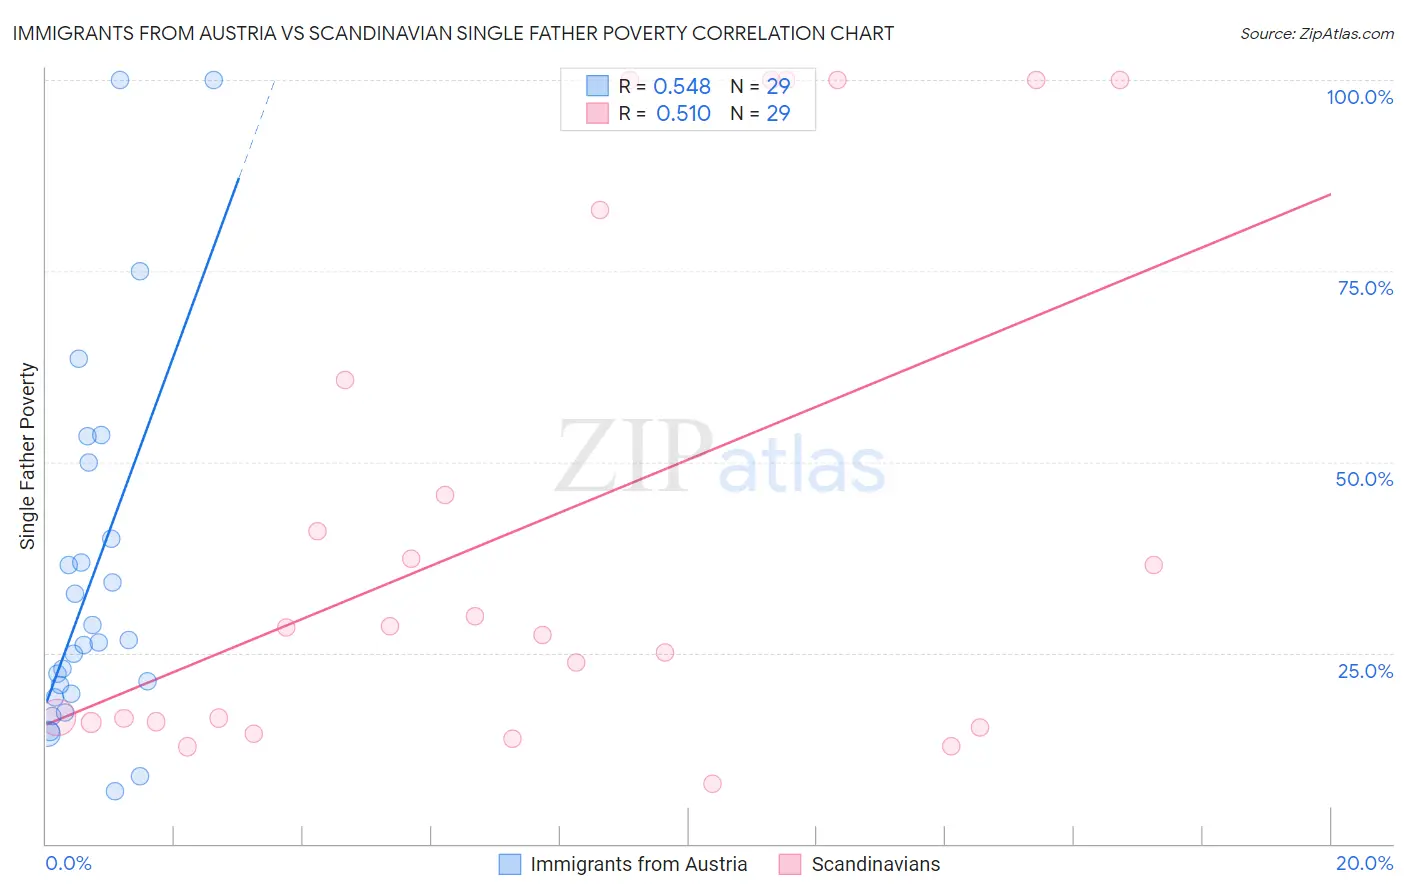
Immigrants from Austria vs Scandinavian Single Father Poverty Correlation Chart
The statistical analysis conducted on geographies consisting of 142,014,739 people shows a substantial positive correlation between the proportion of Immigrants from Austria and poverty level among single fathers in the United States with a correlation coefficient (R) of 0.548 and weighted average of 16.8%. Similarly, the statistical analysis conducted on geographies consisting of 353,551,665 people shows a substantial positive correlation between the proportion of Scandinavians and poverty level among single fathers in the United States with a correlation coefficient (R) of 0.510 and weighted average of 16.3%, a difference of 3.0%.
Single Father Poverty Correlation Summary
| Measurement | Immigrants from Austria | Scandinavian |
| Minimum | 6.9% | 7.8% |
| Maximum | 100.0% | 100.0% |
| Range | 93.1% | 92.2% |
| Mean | 34.9% | 42.2% |
| Median | 26.3% | 28.3% |
| Interquartile 25% (IQ1) | 19.4% | 15.9% |
| Interquartile 75% (IQ3) | 45.0% | 71.8% |
| Interquartile Range (IQR) | 25.6% | 55.9% |
| Standard Deviation (Sample) | 24.1% | 33.9% |
| Standard Deviation (Population) | 23.7% | 33.3% |
Similar Demographics by Single Father Poverty
Demographics Similar to Immigrants from Austria by Single Father Poverty
In terms of single father poverty, the demographic groups most similar to Immigrants from Austria are Immigrants from Norway (16.8%, a difference of 0.080%), Menominee (16.8%, a difference of 0.10%), Hispanic or Latino (16.8%, a difference of 0.15%), Immigrants from Spain (16.7%, a difference of 0.16%), and Immigrants from Denmark (16.7%, a difference of 0.17%).
| Demographics | Rating | Rank | Single Father Poverty |
| Immigrants | England | 9.5 /100 | #216 | Tragic 16.7% |
| Cheyenne | 9.3 /100 | #217 | Tragic 16.7% |
| Immigrants | Uganda | 8.6 /100 | #218 | Tragic 16.7% |
| Immigrants | Ghana | 8.1 /100 | #219 | Tragic 16.7% |
| Immigrants | Denmark | 8.1 /100 | #220 | Tragic 16.7% |
| Immigrants | Greece | 8.1 /100 | #221 | Tragic 16.7% |
| Immigrants | Spain | 8.0 /100 | #222 | Tragic 16.7% |
| Immigrants | Austria | 7.0 /100 | #223 | Tragic 16.8% |
| Immigrants | Norway | 6.5 /100 | #224 | Tragic 16.8% |
| Menominee | 6.4 /100 | #225 | Tragic 16.8% |
| Hispanics or Latinos | 6.1 /100 | #226 | Tragic 16.8% |
| British | 5.6 /100 | #227 | Tragic 16.8% |
| Belgians | 5.3 /100 | #228 | Tragic 16.8% |
| Israelis | 4.6 /100 | #229 | Tragic 16.8% |
| Immigrants | Trinidad and Tobago | 4.5 /100 | #230 | Tragic 16.8% |
Demographics Similar to Scandinavians by Single Father Poverty
In terms of single father poverty, the demographic groups most similar to Scandinavians are Northern European (16.3%, a difference of 0.020%), Costa Rican (16.3%, a difference of 0.060%), Yugoslavian (16.3%, a difference of 0.070%), Immigrants from Morocco (16.3%, a difference of 0.070%), and Immigrants from Sierra Leone (16.3%, a difference of 0.10%).
| Demographics | Rating | Rank | Single Father Poverty |
| Immigrants | Costa Rica | 55.7 /100 | #163 | Average 16.3% |
| Guyanese | 55.2 /100 | #164 | Average 16.3% |
| Immigrants | Bangladesh | 55.1 /100 | #165 | Average 16.3% |
| Immigrants | Europe | 54.8 /100 | #166 | Average 16.3% |
| Yugoslavians | 53.9 /100 | #167 | Average 16.3% |
| Costa Ricans | 53.6 /100 | #168 | Average 16.3% |
| Northern Europeans | 52.8 /100 | #169 | Average 16.3% |
| Scandinavians | 52.3 /100 | #170 | Average 16.3% |
| Immigrants | Morocco | 50.7 /100 | #171 | Average 16.3% |
| Immigrants | Sierra Leone | 50.1 /100 | #172 | Average 16.3% |
| Immigrants | St. Vincent and the Grenadines | 50.0 /100 | #173 | Average 16.3% |
| Swedes | 50.0 /100 | #174 | Average 16.3% |
| Immigrants | Ecuador | 49.7 /100 | #175 | Average 16.3% |
| Vietnamese | 48.0 /100 | #176 | Average 16.3% |
| Immigrants | South Africa | 44.2 /100 | #177 | Average 16.3% |