Arab vs Scandinavian Single Father Poverty
COMPARE
Arab
Scandinavian
Single Father Poverty
Single Father Poverty Comparison
Arabs
Scandinavians
16.6%
SINGLE FATHER POVERTY
12.8/ 100
METRIC RATING
211th/ 347
METRIC RANK
16.3%
SINGLE FATHER POVERTY
52.3/ 100
METRIC RATING
170th/ 347
METRIC RANK
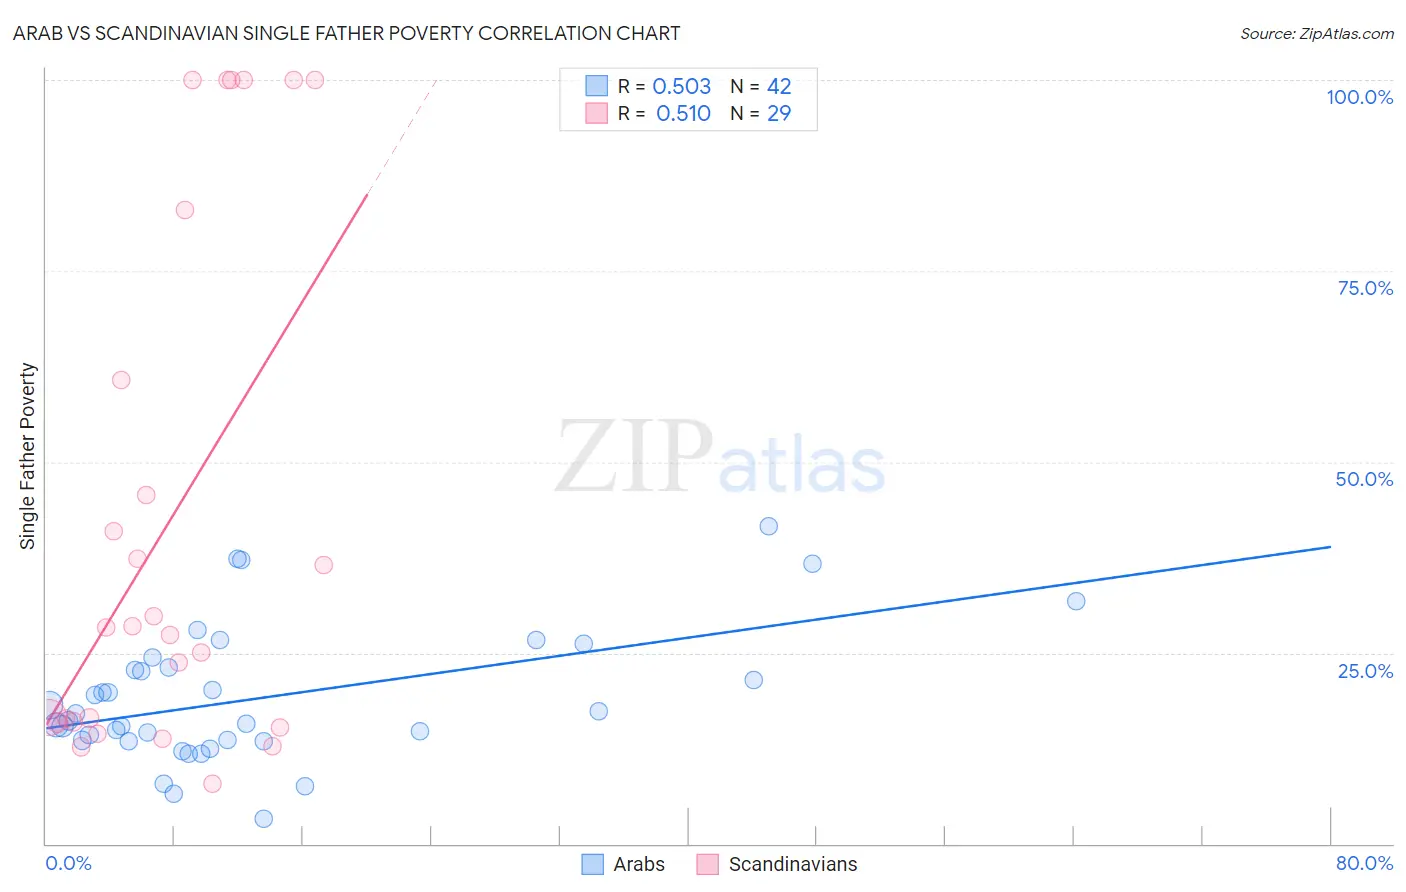
Arab vs Scandinavian Single Father Poverty Correlation Chart
The statistical analysis conducted on geographies consisting of 369,349,186 people shows a substantial positive correlation between the proportion of Arabs and poverty level among single fathers in the United States with a correlation coefficient (R) of 0.503 and weighted average of 16.6%. Similarly, the statistical analysis conducted on geographies consisting of 353,551,665 people shows a substantial positive correlation between the proportion of Scandinavians and poverty level among single fathers in the United States with a correlation coefficient (R) of 0.510 and weighted average of 16.3%, a difference of 2.2%.
Single Father Poverty Correlation Summary
| Measurement | Arab | Scandinavian |
| Minimum | 3.2% | 7.8% |
| Maximum | 41.6% | 100.0% |
| Range | 38.4% | 92.2% |
| Mean | 19.1% | 42.2% |
| Median | 16.6% | 28.3% |
| Interquartile 25% (IQ1) | 13.5% | 15.9% |
| Interquartile 75% (IQ3) | 23.1% | 71.8% |
| Interquartile Range (IQR) | 9.6% | 55.9% |
| Standard Deviation (Sample) | 8.7% | 33.9% |
| Standard Deviation (Population) | 8.6% | 33.3% |
Similar Demographics by Single Father Poverty
Demographics Similar to Arabs by Single Father Poverty
In terms of single father poverty, the demographic groups most similar to Arabs are Guatemalan (16.6%, a difference of 0.0%), European (16.6%, a difference of 0.030%), Immigrants from Senegal (16.6%, a difference of 0.080%), New Zealander (16.6%, a difference of 0.080%), and Eastern European (16.6%, a difference of 0.080%).
| Demographics | Rating | Rank | Single Father Poverty |
| Immigrants | Guatemala | 14.8 /100 | #204 | Poor 16.6% |
| Venezuelans | 14.3 /100 | #205 | Poor 16.6% |
| Immigrants | Senegal | 13.7 /100 | #206 | Poor 16.6% |
| New Zealanders | 13.7 /100 | #207 | Poor 16.6% |
| Eastern Europeans | 13.7 /100 | #208 | Poor 16.6% |
| Europeans | 13.2 /100 | #209 | Poor 16.6% |
| Guatemalans | 12.9 /100 | #210 | Poor 16.6% |
| Arabs | 12.8 /100 | #211 | Poor 16.6% |
| Immigrants | Southern Europe | 11.2 /100 | #212 | Poor 16.7% |
| Ghanaians | 11.0 /100 | #213 | Poor 16.7% |
| Spanish | 10.7 /100 | #214 | Poor 16.7% |
| Immigrants | Scotland | 9.6 /100 | #215 | Tragic 16.7% |
| Immigrants | England | 9.5 /100 | #216 | Tragic 16.7% |
| Cheyenne | 9.3 /100 | #217 | Tragic 16.7% |
| Immigrants | Uganda | 8.6 /100 | #218 | Tragic 16.7% |
Demographics Similar to Scandinavians by Single Father Poverty
In terms of single father poverty, the demographic groups most similar to Scandinavians are Northern European (16.3%, a difference of 0.020%), Costa Rican (16.3%, a difference of 0.060%), Yugoslavian (16.3%, a difference of 0.070%), Immigrants from Morocco (16.3%, a difference of 0.070%), and Immigrants from Sierra Leone (16.3%, a difference of 0.10%).
| Demographics | Rating | Rank | Single Father Poverty |
| Immigrants | Costa Rica | 55.7 /100 | #163 | Average 16.3% |
| Guyanese | 55.2 /100 | #164 | Average 16.3% |
| Immigrants | Bangladesh | 55.1 /100 | #165 | Average 16.3% |
| Immigrants | Europe | 54.8 /100 | #166 | Average 16.3% |
| Yugoslavians | 53.9 /100 | #167 | Average 16.3% |
| Costa Ricans | 53.6 /100 | #168 | Average 16.3% |
| Northern Europeans | 52.8 /100 | #169 | Average 16.3% |
| Scandinavians | 52.3 /100 | #170 | Average 16.3% |
| Immigrants | Morocco | 50.7 /100 | #171 | Average 16.3% |
| Immigrants | Sierra Leone | 50.1 /100 | #172 | Average 16.3% |
| Immigrants | St. Vincent and the Grenadines | 50.0 /100 | #173 | Average 16.3% |
| Swedes | 50.0 /100 | #174 | Average 16.3% |
| Immigrants | Ecuador | 49.7 /100 | #175 | Average 16.3% |
| Vietnamese | 48.0 /100 | #176 | Average 16.3% |
| Immigrants | South Africa | 44.2 /100 | #177 | Average 16.3% |