Slovene vs Scandinavian Single Father Poverty
COMPARE
Slovene
Scandinavian
Single Father Poverty
Single Father Poverty Comparison
Slovenes
Scandinavians
17.3%
SINGLE FATHER POVERTY
0.3/ 100
METRIC RATING
264th/ 347
METRIC RANK
16.3%
SINGLE FATHER POVERTY
52.3/ 100
METRIC RATING
170th/ 347
METRIC RANK
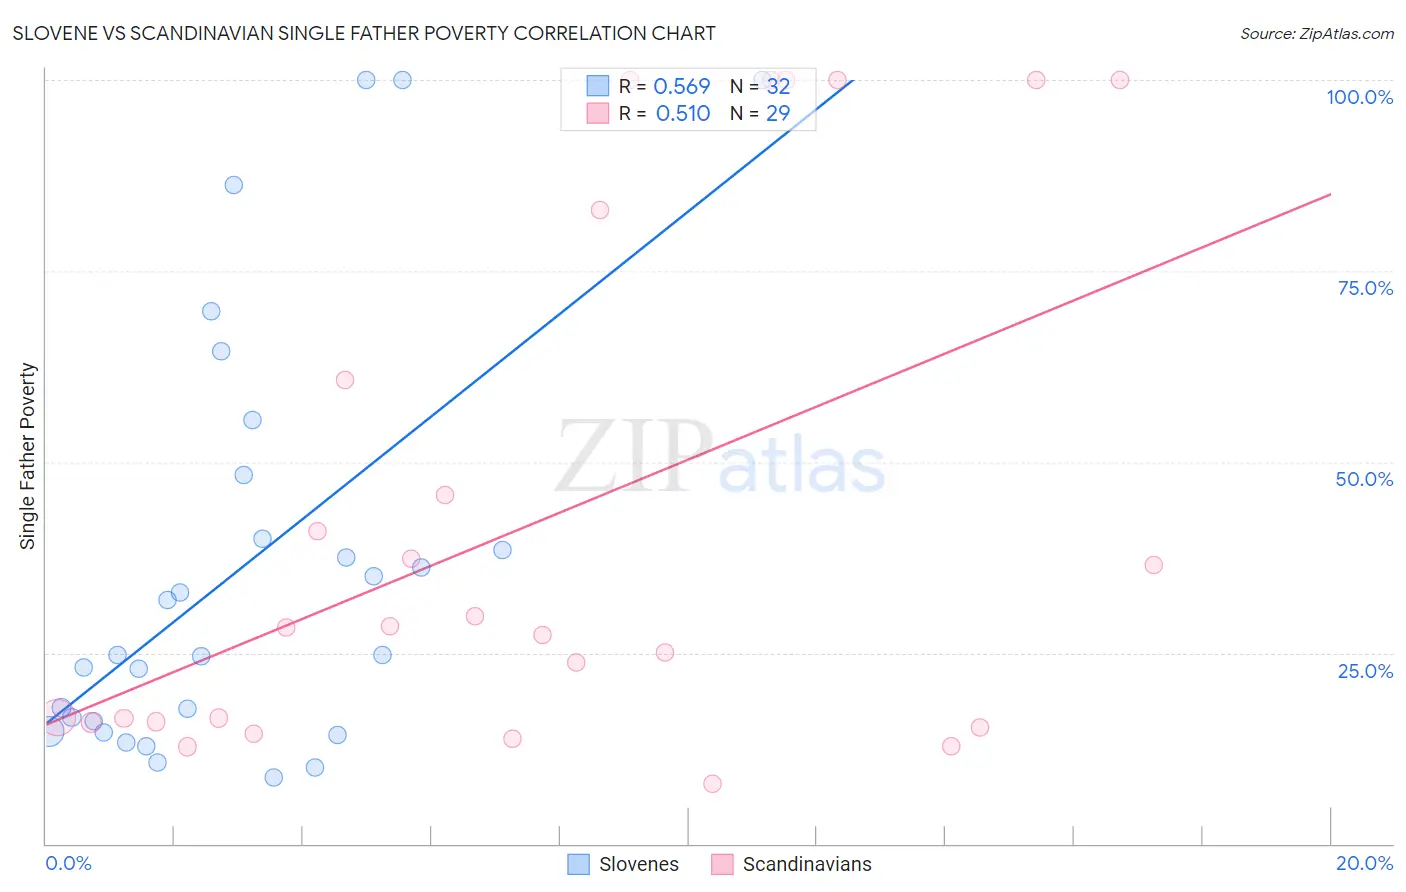
Slovene vs Scandinavian Single Father Poverty Correlation Chart
The statistical analysis conducted on geographies consisting of 209,649,531 people shows a substantial positive correlation between the proportion of Slovenes and poverty level among single fathers in the United States with a correlation coefficient (R) of 0.569 and weighted average of 17.3%. Similarly, the statistical analysis conducted on geographies consisting of 353,551,665 people shows a substantial positive correlation between the proportion of Scandinavians and poverty level among single fathers in the United States with a correlation coefficient (R) of 0.510 and weighted average of 16.3%, a difference of 6.4%.
Single Father Poverty Correlation Summary
| Measurement | Slovene | Scandinavian |
| Minimum | 8.6% | 7.8% |
| Maximum | 100.0% | 100.0% |
| Range | 91.4% | 92.2% |
| Mean | 36.3% | 42.2% |
| Median | 24.8% | 28.3% |
| Interquartile 25% (IQ1) | 15.4% | 15.9% |
| Interquartile 75% (IQ3) | 44.1% | 71.8% |
| Interquartile Range (IQR) | 28.7% | 55.9% |
| Standard Deviation (Sample) | 27.8% | 33.9% |
| Standard Deviation (Population) | 27.4% | 33.3% |
Similar Demographics by Single Father Poverty
Demographics Similar to Slovenes by Single Father Poverty
In terms of single father poverty, the demographic groups most similar to Slovenes are Polish (17.3%, a difference of 0.0%), Jamaican (17.3%, a difference of 0.060%), Haitian (17.3%, a difference of 0.10%), Lithuanian (17.3%, a difference of 0.20%), and Immigrants from Caribbean (17.4%, a difference of 0.20%).
| Demographics | Rating | Rank | Single Father Poverty |
| Immigrants | Albania | 0.7 /100 | #257 | Tragic 17.2% |
| Albanians | 0.7 /100 | #258 | Tragic 17.2% |
| Immigrants | Jamaica | 0.7 /100 | #259 | Tragic 17.2% |
| Spaniards | 0.6 /100 | #260 | Tragic 17.2% |
| Swiss | 0.5 /100 | #261 | Tragic 17.3% |
| Immigrants | Zaire | 0.4 /100 | #262 | Tragic 17.3% |
| Lithuanians | 0.4 /100 | #263 | Tragic 17.3% |
| Slovenes | 0.3 /100 | #264 | Tragic 17.3% |
| Poles | 0.3 /100 | #265 | Tragic 17.3% |
| Jamaicans | 0.3 /100 | #266 | Tragic 17.3% |
| Haitians | 0.3 /100 | #267 | Tragic 17.3% |
| Immigrants | Caribbean | 0.3 /100 | #268 | Tragic 17.4% |
| Slavs | 0.3 /100 | #269 | Tragic 17.4% |
| Indonesians | 0.2 /100 | #270 | Tragic 17.4% |
| French American Indians | 0.2 /100 | #271 | Tragic 17.4% |
Demographics Similar to Scandinavians by Single Father Poverty
In terms of single father poverty, the demographic groups most similar to Scandinavians are Northern European (16.3%, a difference of 0.020%), Costa Rican (16.3%, a difference of 0.060%), Yugoslavian (16.3%, a difference of 0.070%), Immigrants from Morocco (16.3%, a difference of 0.070%), and Immigrants from Sierra Leone (16.3%, a difference of 0.10%).
| Demographics | Rating | Rank | Single Father Poverty |
| Immigrants | Costa Rica | 55.7 /100 | #163 | Average 16.3% |
| Guyanese | 55.2 /100 | #164 | Average 16.3% |
| Immigrants | Bangladesh | 55.1 /100 | #165 | Average 16.3% |
| Immigrants | Europe | 54.8 /100 | #166 | Average 16.3% |
| Yugoslavians | 53.9 /100 | #167 | Average 16.3% |
| Costa Ricans | 53.6 /100 | #168 | Average 16.3% |
| Northern Europeans | 52.8 /100 | #169 | Average 16.3% |
| Scandinavians | 52.3 /100 | #170 | Average 16.3% |
| Immigrants | Morocco | 50.7 /100 | #171 | Average 16.3% |
| Immigrants | Sierra Leone | 50.1 /100 | #172 | Average 16.3% |
| Immigrants | St. Vincent and the Grenadines | 50.0 /100 | #173 | Average 16.3% |
| Swedes | 50.0 /100 | #174 | Average 16.3% |
| Immigrants | Ecuador | 49.7 /100 | #175 | Average 16.3% |
| Vietnamese | 48.0 /100 | #176 | Average 16.3% |
| Immigrants | South Africa | 44.2 /100 | #177 | Average 16.3% |