Chickasaw vs Immigrants from Cambodia Single Father Poverty
COMPARE
Chickasaw
Immigrants from Cambodia
Single Father Poverty
Single Father Poverty Comparison
Chickasaw
Immigrants from Cambodia
19.0%
SINGLE FATHER POVERTY
0.0/ 100
METRIC RATING
315th/ 347
METRIC RANK
14.9%
SINGLE FATHER POVERTY
99.9/ 100
METRIC RATING
46th/ 347
METRIC RANK
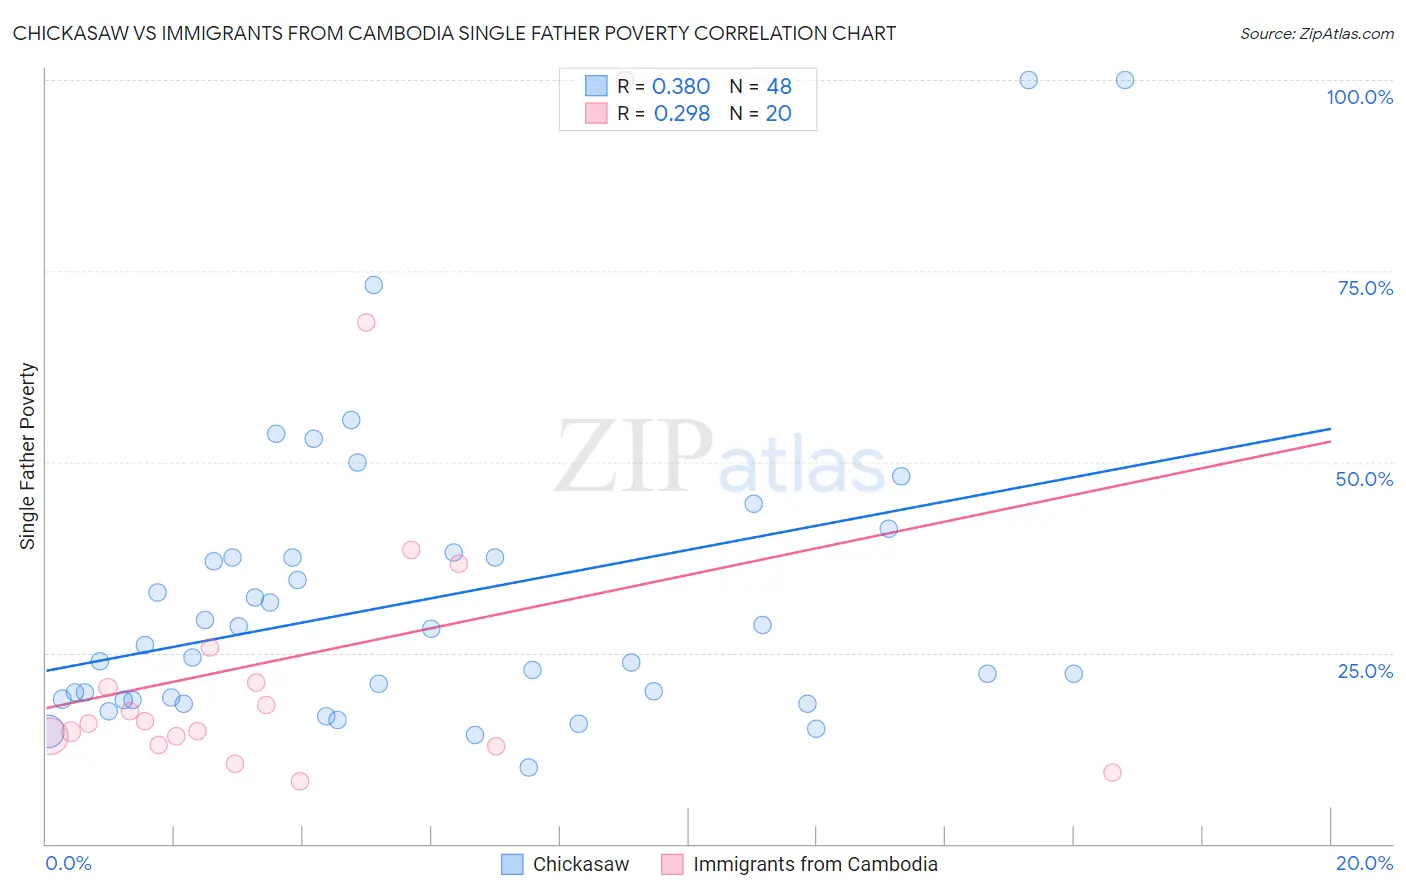
Chickasaw vs Immigrants from Cambodia Single Father Poverty Correlation Chart
The statistical analysis conducted on geographies consisting of 131,493,414 people shows a mild positive correlation between the proportion of Chickasaw and poverty level among single fathers in the United States with a correlation coefficient (R) of 0.380 and weighted average of 19.0%. Similarly, the statistical analysis conducted on geographies consisting of 178,014,507 people shows a weak positive correlation between the proportion of Immigrants from Cambodia and poverty level among single fathers in the United States with a correlation coefficient (R) of 0.298 and weighted average of 14.9%, a difference of 26.9%.
Single Father Poverty Correlation Summary
| Measurement | Chickasaw | Immigrants from Cambodia |
| Minimum | 10.0% | 8.1% |
| Maximum | 100.0% | 100.0% |
| Range | 90.0% | 91.9% |
| Mean | 31.9% | 24.5% |
| Median | 25.2% | 15.9% |
| Interquartile 25% (IQ1) | 18.9% | 13.6% |
| Interquartile 75% (IQ3) | 37.5% | 23.4% |
| Interquartile Range (IQR) | 18.6% | 9.8% |
| Standard Deviation (Sample) | 19.5% | 22.5% |
| Standard Deviation (Population) | 19.3% | 21.9% |
Similar Demographics by Single Father Poverty
Demographics Similar to Chickasaw by Single Father Poverty
In terms of single father poverty, the demographic groups most similar to Chickasaw are Delaware (18.9%, a difference of 0.16%), Potawatomi (18.9%, a difference of 0.32%), Osage (19.0%, a difference of 0.40%), Immigrants from Dominica (18.9%, a difference of 0.52%), and Nonimmigrants (18.8%, a difference of 0.57%).
| Demographics | Rating | Rank | Single Father Poverty |
| Ottawa | 0.0 /100 | #308 | Tragic 18.6% |
| Immigrants | Micronesia | 0.0 /100 | #309 | Tragic 18.6% |
| Chippewa | 0.0 /100 | #310 | Tragic 18.8% |
| Immigrants | Nonimmigrants | 0.0 /100 | #311 | Tragic 18.8% |
| Immigrants | Dominica | 0.0 /100 | #312 | Tragic 18.9% |
| Potawatomi | 0.0 /100 | #313 | Tragic 18.9% |
| Delaware | 0.0 /100 | #314 | Tragic 18.9% |
| Chickasaw | 0.0 /100 | #315 | Tragic 19.0% |
| Osage | 0.0 /100 | #316 | Tragic 19.0% |
| Dominicans | 0.0 /100 | #317 | Tragic 19.1% |
| Dutch West Indians | 0.0 /100 | #318 | Tragic 19.2% |
| Slovaks | 0.0 /100 | #319 | Tragic 19.3% |
| Inupiat | 0.0 /100 | #320 | Tragic 19.5% |
| Cherokee | 0.0 /100 | #321 | Tragic 19.6% |
| Creek | 0.0 /100 | #322 | Tragic 19.8% |
Demographics Similar to Immigrants from Cambodia by Single Father Poverty
In terms of single father poverty, the demographic groups most similar to Immigrants from Cambodia are Immigrants from China (14.9%, a difference of 0.030%), Malaysian (14.9%, a difference of 0.030%), Immigrants from Somalia (14.9%, a difference of 0.12%), Immigrants from Eastern Asia (15.0%, a difference of 0.19%), and Bhutanese (15.0%, a difference of 0.24%).
| Demographics | Rating | Rank | Single Father Poverty |
| Immigrants | Asia | 100.0 /100 | #39 | Exceptional 14.7% |
| Pima | 100.0 /100 | #40 | Exceptional 14.8% |
| Indians (Asian) | 100.0 /100 | #41 | Exceptional 14.8% |
| Immigrants | Nepal | 100.0 /100 | #42 | Exceptional 14.8% |
| Immigrants | Eritrea | 100.0 /100 | #43 | Exceptional 14.8% |
| Salvadorans | 100.0 /100 | #44 | Exceptional 14.9% |
| Immigrants | Somalia | 100.0 /100 | #45 | Exceptional 14.9% |
| Immigrants | Cambodia | 99.9 /100 | #46 | Exceptional 14.9% |
| Immigrants | China | 99.9 /100 | #47 | Exceptional 14.9% |
| Malaysians | 99.9 /100 | #48 | Exceptional 14.9% |
| Immigrants | Eastern Asia | 99.9 /100 | #49 | Exceptional 15.0% |
| Bhutanese | 99.9 /100 | #50 | Exceptional 15.0% |
| Immigrants | Pakistan | 99.9 /100 | #51 | Exceptional 15.0% |
| Immigrants | El Salvador | 99.9 /100 | #52 | Exceptional 15.0% |
| Immigrants | Kenya | 99.9 /100 | #53 | Exceptional 15.0% |