Croatian vs Scandinavian Single Father Poverty
COMPARE
Croatian
Scandinavian
Single Father Poverty
Single Father Poverty Comparison
Croatians
Scandinavians
17.1%
SINGLE FATHER POVERTY
1.0/ 100
METRIC RATING
252nd/ 347
METRIC RANK
16.3%
SINGLE FATHER POVERTY
52.3/ 100
METRIC RATING
170th/ 347
METRIC RANK
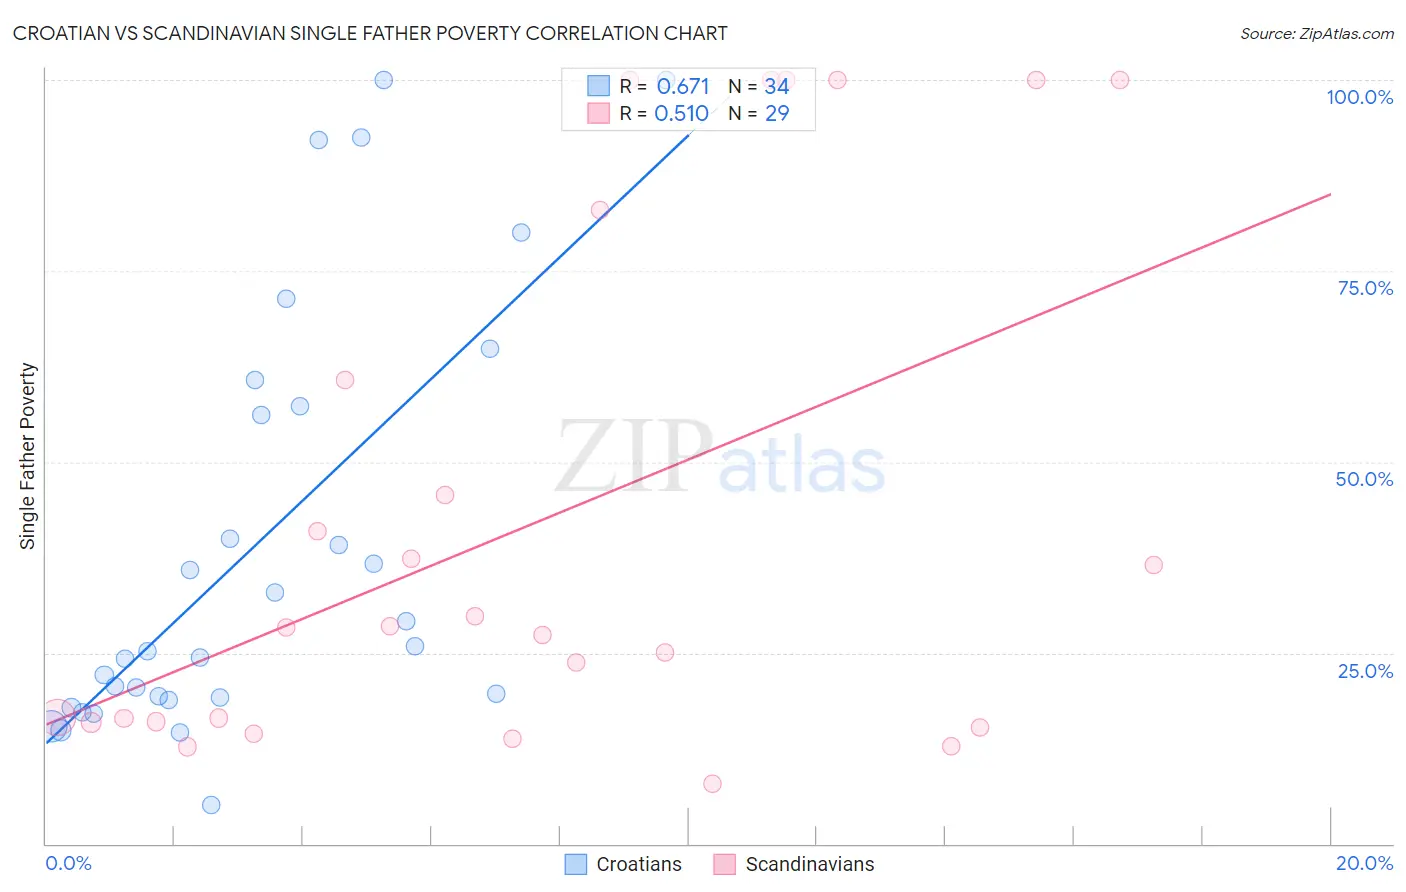
Croatian vs Scandinavian Single Father Poverty Correlation Chart
The statistical analysis conducted on geographies consisting of 290,349,710 people shows a significant positive correlation between the proportion of Croatians and poverty level among single fathers in the United States with a correlation coefficient (R) of 0.671 and weighted average of 17.1%. Similarly, the statistical analysis conducted on geographies consisting of 353,551,665 people shows a substantial positive correlation between the proportion of Scandinavians and poverty level among single fathers in the United States with a correlation coefficient (R) of 0.510 and weighted average of 16.3%, a difference of 5.2%.
Single Father Poverty Correlation Summary
| Measurement | Croatian | Scandinavian |
| Minimum | 5.0% | 7.8% |
| Maximum | 100.0% | 100.0% |
| Range | 95.0% | 92.2% |
| Mean | 39.1% | 42.2% |
| Median | 25.6% | 28.3% |
| Interquartile 25% (IQ1) | 19.1% | 15.9% |
| Interquartile 75% (IQ3) | 57.3% | 71.8% |
| Interquartile Range (IQR) | 38.2% | 55.9% |
| Standard Deviation (Sample) | 27.7% | 33.9% |
| Standard Deviation (Population) | 27.3% | 33.3% |
Similar Demographics by Single Father Poverty
Demographics Similar to Croatians by Single Father Poverty
In terms of single father poverty, the demographic groups most similar to Croatians are Cree (17.1%, a difference of 0.010%), Luxembourger (17.1%, a difference of 0.10%), Austrian (17.1%, a difference of 0.11%), Immigrants from Honduras (17.1%, a difference of 0.12%), and Canadian (17.1%, a difference of 0.24%).
| Demographics | Rating | Rank | Single Father Poverty |
| Trinidadians and Tobagonians | 1.5 /100 | #245 | Tragic 17.0% |
| Immigrants | Ireland | 1.4 /100 | #246 | Tragic 17.1% |
| Greeks | 1.3 /100 | #247 | Tragic 17.1% |
| Czechoslovakians | 1.3 /100 | #248 | Tragic 17.1% |
| Canadians | 1.3 /100 | #249 | Tragic 17.1% |
| Austrians | 1.1 /100 | #250 | Tragic 17.1% |
| Luxembourgers | 1.1 /100 | #251 | Tragic 17.1% |
| Croatians | 1.0 /100 | #252 | Tragic 17.1% |
| Cree | 1.0 /100 | #253 | Tragic 17.1% |
| Immigrants | Honduras | 0.9 /100 | #254 | Tragic 17.1% |
| Sierra Leoneans | 0.8 /100 | #255 | Tragic 17.2% |
| Immigrants | Haiti | 0.8 /100 | #256 | Tragic 17.2% |
| Immigrants | Albania | 0.7 /100 | #257 | Tragic 17.2% |
| Albanians | 0.7 /100 | #258 | Tragic 17.2% |
| Immigrants | Jamaica | 0.7 /100 | #259 | Tragic 17.2% |
Demographics Similar to Scandinavians by Single Father Poverty
In terms of single father poverty, the demographic groups most similar to Scandinavians are Northern European (16.3%, a difference of 0.020%), Costa Rican (16.3%, a difference of 0.060%), Yugoslavian (16.3%, a difference of 0.070%), Immigrants from Morocco (16.3%, a difference of 0.070%), and Immigrants from Sierra Leone (16.3%, a difference of 0.10%).
| Demographics | Rating | Rank | Single Father Poverty |
| Immigrants | Costa Rica | 55.7 /100 | #163 | Average 16.3% |
| Guyanese | 55.2 /100 | #164 | Average 16.3% |
| Immigrants | Bangladesh | 55.1 /100 | #165 | Average 16.3% |
| Immigrants | Europe | 54.8 /100 | #166 | Average 16.3% |
| Yugoslavians | 53.9 /100 | #167 | Average 16.3% |
| Costa Ricans | 53.6 /100 | #168 | Average 16.3% |
| Northern Europeans | 52.8 /100 | #169 | Average 16.3% |
| Scandinavians | 52.3 /100 | #170 | Average 16.3% |
| Immigrants | Morocco | 50.7 /100 | #171 | Average 16.3% |
| Immigrants | Sierra Leone | 50.1 /100 | #172 | Average 16.3% |
| Immigrants | St. Vincent and the Grenadines | 50.0 /100 | #173 | Average 16.3% |
| Swedes | 50.0 /100 | #174 | Average 16.3% |
| Immigrants | Ecuador | 49.7 /100 | #175 | Average 16.3% |
| Vietnamese | 48.0 /100 | #176 | Average 16.3% |
| Immigrants | South Africa | 44.2 /100 | #177 | Average 16.3% |