Chickasaw vs Scandinavian Births to Unmarried Women
COMPARE
Chickasaw
Scandinavian
Births to Unmarried Women
Births to Unmarried Women Comparison
Chickasaw
Scandinavians
36.3%
BIRTHS TO UNMARRIED WOMEN
0.2/ 100
METRIC RATING
255th/ 347
METRIC RANK
29.8%
BIRTHS TO UNMARRIED WOMEN
92.7/ 100
METRIC RATING
113th/ 347
METRIC RANK
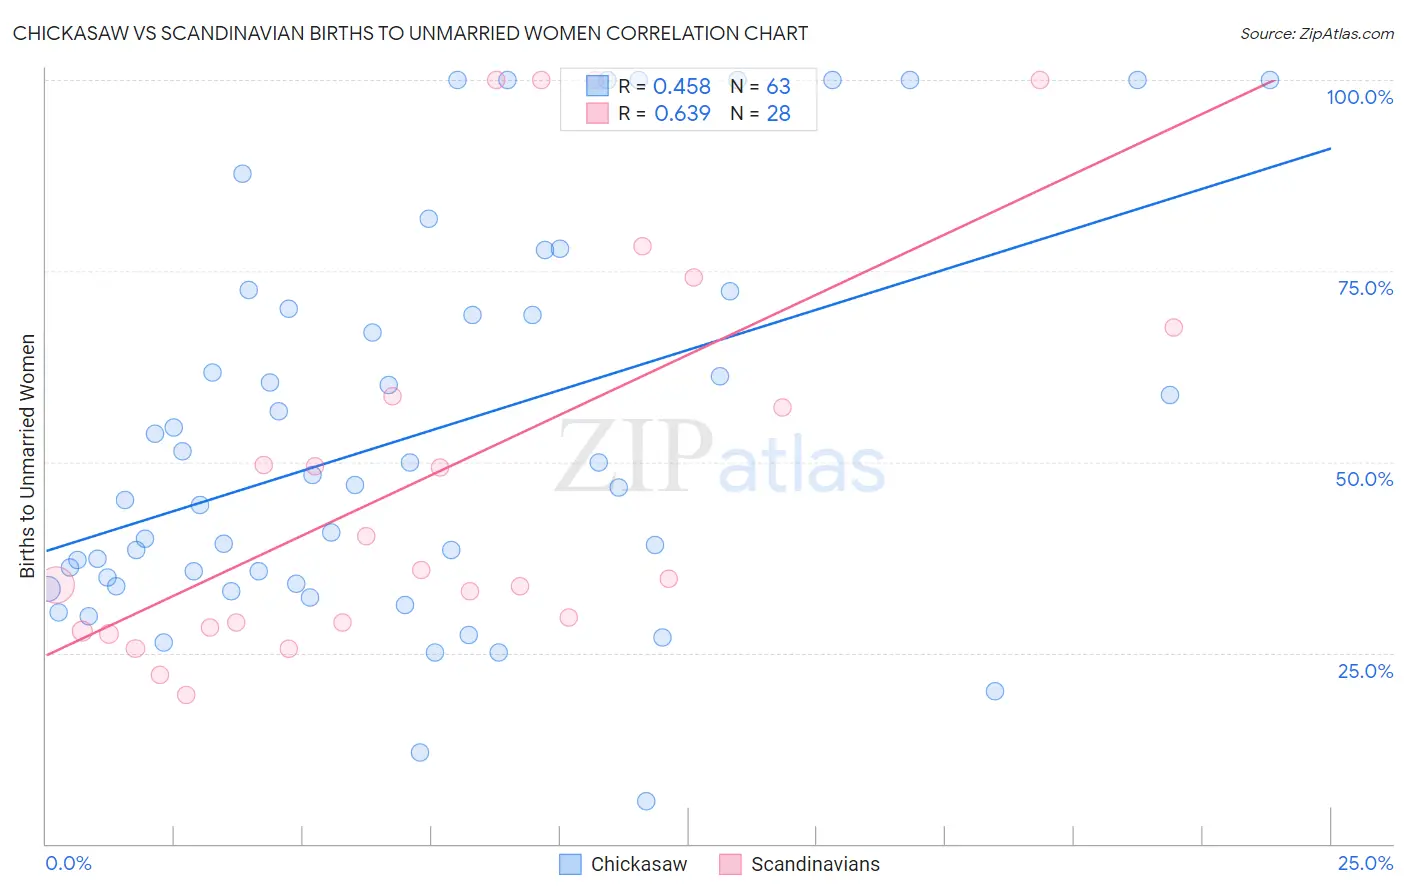
Chickasaw vs Scandinavian Births to Unmarried Women Correlation Chart
The statistical analysis conducted on geographies consisting of 143,483,709 people shows a moderate positive correlation between the proportion of Chickasaw and percentage of births to unmarried women in the United States with a correlation coefficient (R) of 0.458 and weighted average of 36.3%. Similarly, the statistical analysis conducted on geographies consisting of 430,139,153 people shows a significant positive correlation between the proportion of Scandinavians and percentage of births to unmarried women in the United States with a correlation coefficient (R) of 0.639 and weighted average of 29.8%, a difference of 21.9%.
Births to Unmarried Women Correlation Summary
| Measurement | Chickasaw | Scandinavian |
| Minimum | 5.6% | 19.6% |
| Maximum | 100.0% | 100.0% |
| Range | 94.4% | 80.4% |
| Mean | 53.6% | 48.5% |
| Median | 47.0% | 35.3% |
| Interquartile 25% (IQ1) | 34.0% | 28.6% |
| Interquartile 75% (IQ3) | 70.0% | 63.0% |
| Interquartile Range (IQR) | 36.0% | 34.4% |
| Standard Deviation (Sample) | 25.5% | 26.4% |
| Standard Deviation (Population) | 25.3% | 25.9% |
Similar Demographics by Births to Unmarried Women
Demographics Similar to Chickasaw by Births to Unmarried Women
In terms of births to unmarried women, the demographic groups most similar to Chickasaw are Immigrants from Trinidad and Tobago (36.3%, a difference of 0.0%), Immigrants from Grenada (36.3%, a difference of 0.030%), Potawatomi (36.2%, a difference of 0.14%), American (36.4%, a difference of 0.31%), and Immigrants from Portugal (36.2%, a difference of 0.36%).
| Demographics | Rating | Rank | Births to Unmarried Women |
| Immigrants | Nonimmigrants | 0.6 /100 | #248 | Tragic 35.5% |
| Bermudans | 0.6 /100 | #249 | Tragic 35.5% |
| Mexican American Indians | 0.4 /100 | #250 | Tragic 35.7% |
| Immigrants | Western Africa | 0.3 /100 | #251 | Tragic 36.0% |
| Salvadorans | 0.3 /100 | #252 | Tragic 36.0% |
| Immigrants | Portugal | 0.2 /100 | #253 | Tragic 36.2% |
| Potawatomi | 0.2 /100 | #254 | Tragic 36.2% |
| Chickasaw | 0.2 /100 | #255 | Tragic 36.3% |
| Immigrants | Trinidad and Tobago | 0.2 /100 | #256 | Tragic 36.3% |
| Immigrants | Grenada | 0.2 /100 | #257 | Tragic 36.3% |
| Americans | 0.2 /100 | #258 | Tragic 36.4% |
| Immigrants | El Salvador | 0.2 /100 | #259 | Tragic 36.4% |
| Ottawa | 0.2 /100 | #260 | Tragic 36.5% |
| Trinidadians and Tobagonians | 0.2 /100 | #261 | Tragic 36.5% |
| French American Indians | 0.1 /100 | #262 | Tragic 36.6% |
Demographics Similar to Scandinavians by Births to Unmarried Women
In terms of births to unmarried women, the demographic groups most similar to Scandinavians are Immigrants from Croatia (29.8%, a difference of 0.060%), Basque (29.7%, a difference of 0.10%), Immigrants from Hungary (29.7%, a difference of 0.11%), Immigrants from Ethiopia (29.7%, a difference of 0.25%), and Greek (29.7%, a difference of 0.28%).
| Demographics | Rating | Rank | Births to Unmarried Women |
| Swedes | 93.8 /100 | #106 | Exceptional 29.6% |
| Immigrants | Brazil | 93.7 /100 | #107 | Exceptional 29.6% |
| Paraguayans | 93.5 /100 | #108 | Exceptional 29.7% |
| Greeks | 93.4 /100 | #109 | Exceptional 29.7% |
| Immigrants | Ethiopia | 93.4 /100 | #110 | Exceptional 29.7% |
| Immigrants | Hungary | 93.0 /100 | #111 | Exceptional 29.7% |
| Basques | 93.0 /100 | #112 | Exceptional 29.7% |
| Scandinavians | 92.7 /100 | #113 | Exceptional 29.8% |
| Immigrants | Croatia | 92.6 /100 | #114 | Exceptional 29.8% |
| Ethiopians | 91.9 /100 | #115 | Exceptional 29.8% |
| Immigrants | Italy | 91.7 /100 | #116 | Exceptional 29.9% |
| Immigrants | Netherlands | 91.1 /100 | #117 | Exceptional 29.9% |
| Immigrants | Norway | 91.0 /100 | #118 | Exceptional 29.9% |
| Argentineans | 90.5 /100 | #119 | Exceptional 30.0% |
| Ugandans | 89.2 /100 | #120 | Excellent 30.1% |