Cheyenne vs Samoan GED/Equivalency
COMPARE
Cheyenne
Samoan
GED/Equivalency
GED/Equivalency Comparison
Cheyenne
Samoans
82.7%
GED/EQUIVALENCY
0.1/ 100
METRIC RATING
280th/ 347
METRIC RANK
84.9%
GED/EQUIVALENCY
13.7/ 100
METRIC RATING
206th/ 347
METRIC RANK
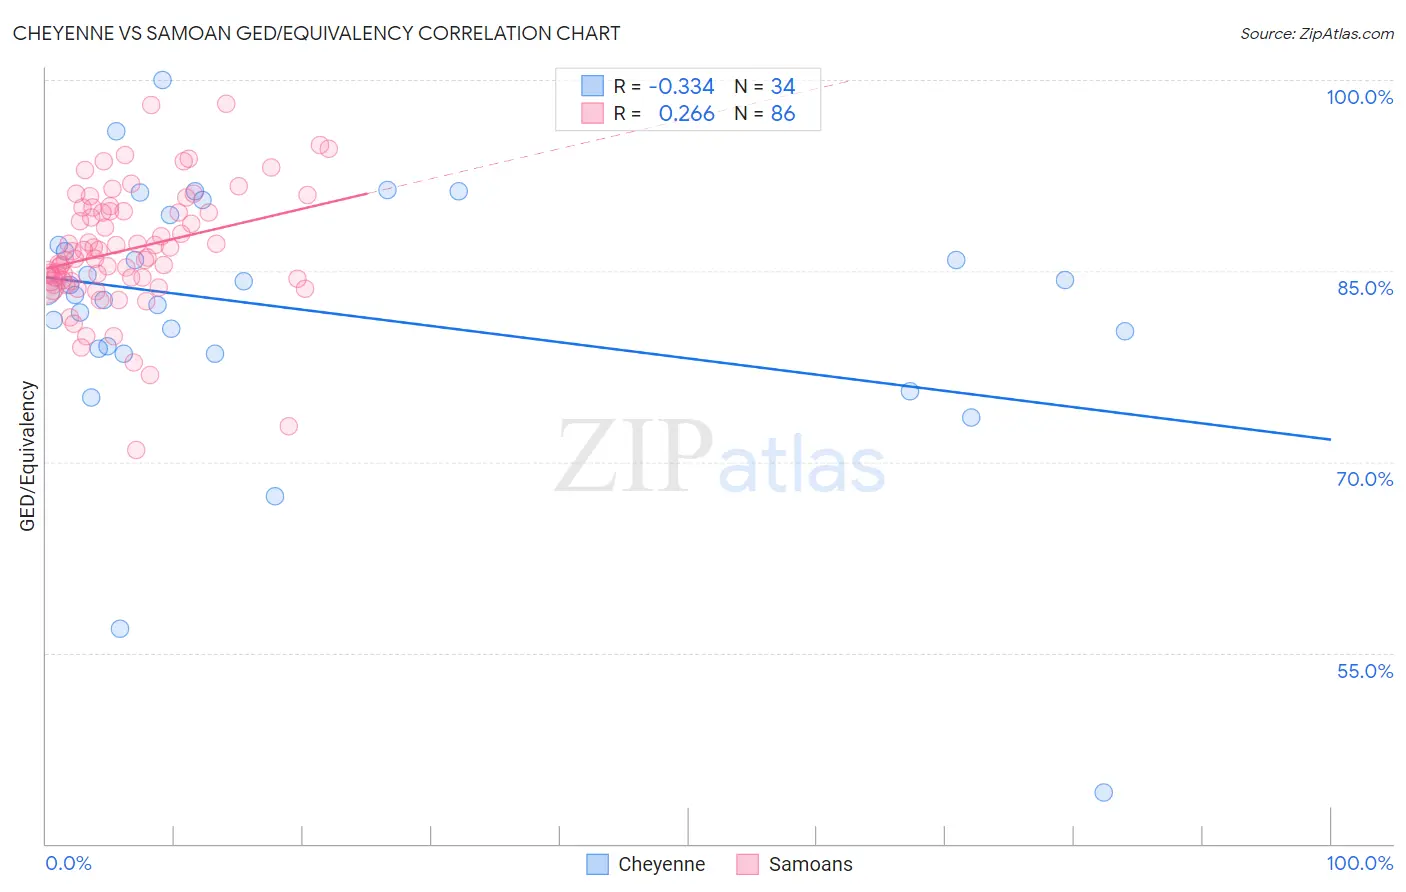
Cheyenne vs Samoan GED/Equivalency Correlation Chart
The statistical analysis conducted on geographies consisting of 80,719,411 people shows a mild negative correlation between the proportion of Cheyenne and percentage of population with at least ged/equivalency education in the United States with a correlation coefficient (R) of -0.334 and weighted average of 82.7%. Similarly, the statistical analysis conducted on geographies consisting of 225,205,484 people shows a weak positive correlation between the proportion of Samoans and percentage of population with at least ged/equivalency education in the United States with a correlation coefficient (R) of 0.266 and weighted average of 84.9%, a difference of 2.7%.
GED/Equivalency Correlation Summary
| Measurement | Cheyenne | Samoan |
| Minimum | 44.1% | 70.9% |
| Maximum | 100.0% | 98.1% |
| Range | 55.9% | 27.3% |
| Mean | 81.9% | 86.7% |
| Median | 83.3% | 86.3% |
| Interquartile 25% (IQ1) | 78.8% | 84.2% |
| Interquartile 75% (IQ3) | 87.0% | 89.7% |
| Interquartile Range (IQR) | 8.2% | 5.5% |
| Standard Deviation (Sample) | 10.4% | 4.8% |
| Standard Deviation (Population) | 10.3% | 4.8% |
Similar Demographics by GED/Equivalency
Demographics Similar to Cheyenne by GED/Equivalency
In terms of ged/equivalency, the demographic groups most similar to Cheyenne are Immigrants from Laos (82.7%, a difference of 0.010%), Immigrants from Fiji (82.7%, a difference of 0.010%), Arapaho (82.8%, a difference of 0.050%), Black/African American (82.8%, a difference of 0.060%), and Seminole (82.8%, a difference of 0.090%).
| Demographics | Rating | Rank | GED/Equivalency |
| Pennsylvania Germans | 0.1 /100 | #273 | Tragic 82.9% |
| Immigrants | Trinidad and Tobago | 0.1 /100 | #274 | Tragic 82.8% |
| Seminole | 0.1 /100 | #275 | Tragic 82.8% |
| Blacks/African Americans | 0.1 /100 | #276 | Tragic 82.8% |
| Arapaho | 0.1 /100 | #277 | Tragic 82.8% |
| Immigrants | Laos | 0.1 /100 | #278 | Tragic 82.7% |
| Immigrants | Fiji | 0.1 /100 | #279 | Tragic 82.7% |
| Cheyenne | 0.1 /100 | #280 | Tragic 82.7% |
| Sioux | 0.1 /100 | #281 | Tragic 82.6% |
| Immigrants | Immigrants | 0.1 /100 | #282 | Tragic 82.6% |
| Indonesians | 0.1 /100 | #283 | Tragic 82.5% |
| Immigrants | Barbados | 0.1 /100 | #284 | Tragic 82.4% |
| Cajuns | 0.0 /100 | #285 | Tragic 82.4% |
| Immigrants | West Indies | 0.0 /100 | #286 | Tragic 82.4% |
| Japanese | 0.0 /100 | #287 | Tragic 82.4% |
Demographics Similar to Samoans by GED/Equivalency
In terms of ged/equivalency, the demographic groups most similar to Samoans are Hmong (84.9%, a difference of 0.020%), Liberian (85.0%, a difference of 0.040%), Marshallese (84.9%, a difference of 0.050%), Colombian (84.9%, a difference of 0.060%), and Panamanian (85.0%, a difference of 0.070%).
| Demographics | Rating | Rank | GED/Equivalency |
| Somalis | 16.4 /100 | #199 | Poor 85.0% |
| Uruguayans | 16.0 /100 | #200 | Poor 85.0% |
| Portuguese | 15.9 /100 | #201 | Poor 85.0% |
| Cree | 15.9 /100 | #202 | Poor 85.0% |
| Panamanians | 15.3 /100 | #203 | Poor 85.0% |
| Hawaiians | 15.2 /100 | #204 | Poor 85.0% |
| Liberians | 14.6 /100 | #205 | Poor 85.0% |
| Samoans | 13.7 /100 | #206 | Poor 84.9% |
| Hmong | 13.1 /100 | #207 | Poor 84.9% |
| Marshallese | 12.5 /100 | #208 | Poor 84.9% |
| Colombians | 12.3 /100 | #209 | Poor 84.9% |
| Immigrants | Cameroon | 12.1 /100 | #210 | Poor 84.9% |
| South Americans | 10.9 /100 | #211 | Poor 84.8% |
| Immigrants | Somalia | 10.6 /100 | #212 | Poor 84.8% |
| Immigrants | Philippines | 10.0 /100 | #213 | Poor 84.8% |