Cheyenne vs Samoan 8th Grade
COMPARE
Cheyenne
Samoan
8th Grade
8th Grade Comparison
Cheyenne
Samoans
96.1%
8TH GRADE
93.3/ 100
METRIC RATING
129th/ 347
METRIC RANK
95.4%
8TH GRADE
8.4/ 100
METRIC RATING
216th/ 347
METRIC RANK
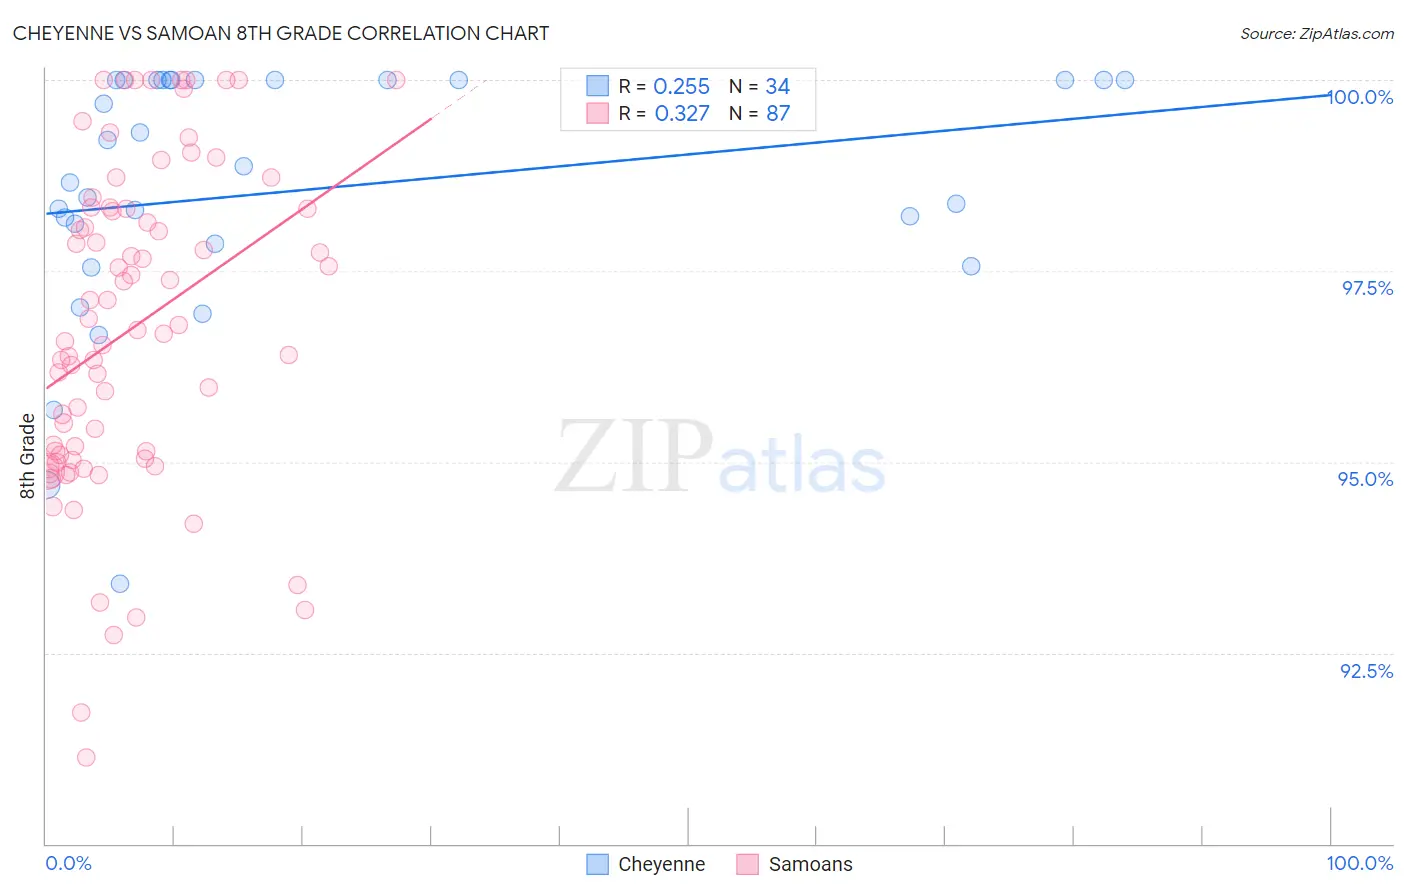
Cheyenne vs Samoan 8th Grade Correlation Chart
The statistical analysis conducted on geographies consisting of 80,719,411 people shows a weak positive correlation between the proportion of Cheyenne and percentage of population with at least 8th grade education in the United States with a correlation coefficient (R) of 0.255 and weighted average of 96.1%. Similarly, the statistical analysis conducted on geographies consisting of 225,201,909 people shows a mild positive correlation between the proportion of Samoans and percentage of population with at least 8th grade education in the United States with a correlation coefficient (R) of 0.327 and weighted average of 95.4%, a difference of 0.82%.
8th Grade Correlation Summary
| Measurement | Cheyenne | Samoan |
| Minimum | 93.4% | 91.1% |
| Maximum | 100.0% | 100.0% |
| Range | 6.6% | 8.9% |
| Mean | 98.6% | 96.7% |
| Median | 98.8% | 96.7% |
| Interquartile 25% (IQ1) | 97.8% | 95.0% |
| Interquartile 75% (IQ3) | 100.0% | 98.3% |
| Interquartile Range (IQR) | 2.2% | 3.3% |
| Standard Deviation (Sample) | 1.7% | 2.1% |
| Standard Deviation (Population) | 1.6% | 2.1% |
Similar Demographics by 8th Grade
Demographics Similar to Cheyenne by 8th Grade
In terms of 8th grade, the demographic groups most similar to Cheyenne are Immigrants from Bosnia and Herzegovina (96.2%, a difference of 0.010%), Immigrants from Romania (96.2%, a difference of 0.020%), Choctaw (96.2%, a difference of 0.020%), Immigrants from Serbia (96.2%, a difference of 0.020%), and Soviet Union (96.1%, a difference of 0.020%).
| Demographics | Rating | Rank | 8th Grade |
| Immigrants | Europe | 95.3 /100 | #122 | Exceptional 96.2% |
| Filipinos | 94.6 /100 | #123 | Exceptional 96.2% |
| Palestinians | 94.6 /100 | #124 | Exceptional 96.2% |
| Immigrants | Romania | 94.1 /100 | #125 | Exceptional 96.2% |
| Choctaw | 94.0 /100 | #126 | Exceptional 96.2% |
| Immigrants | Serbia | 94.0 /100 | #127 | Exceptional 96.2% |
| Immigrants | Bosnia and Herzegovina | 93.9 /100 | #128 | Exceptional 96.2% |
| Cheyenne | 93.3 /100 | #129 | Exceptional 96.1% |
| Soviet Union | 92.6 /100 | #130 | Exceptional 96.1% |
| Pueblo | 92.3 /100 | #131 | Exceptional 96.1% |
| Immigrants | Kuwait | 92.2 /100 | #132 | Exceptional 96.1% |
| Immigrants | Turkey | 91.7 /100 | #133 | Exceptional 96.1% |
| Immigrants | Hungary | 91.5 /100 | #134 | Exceptional 96.1% |
| Basques | 91.5 /100 | #135 | Exceptional 96.1% |
| Jordanians | 91.3 /100 | #136 | Exceptional 96.1% |
Demographics Similar to Samoans by 8th Grade
In terms of 8th grade, the demographic groups most similar to Samoans are Immigrants from Eastern Asia (95.4%, a difference of 0.0%), Laotian (95.4%, a difference of 0.010%), Immigrants from Chile (95.4%, a difference of 0.010%), Immigrants from Liberia (95.4%, a difference of 0.010%), and Dutch West Indian (95.4%, a difference of 0.010%).
| Demographics | Rating | Rank | 8th Grade |
| Immigrants | Lebanon | 13.7 /100 | #209 | Poor 95.4% |
| Africans | 13.6 /100 | #210 | Poor 95.4% |
| Immigrants | Morocco | 12.4 /100 | #211 | Poor 95.4% |
| Immigrants | Pakistan | 9.7 /100 | #212 | Tragic 95.4% |
| Laotians | 9.0 /100 | #213 | Tragic 95.4% |
| Immigrants | Chile | 9.0 /100 | #214 | Tragic 95.4% |
| Immigrants | Liberia | 8.9 /100 | #215 | Tragic 95.4% |
| Samoans | 8.4 /100 | #216 | Tragic 95.4% |
| Immigrants | Eastern Asia | 8.3 /100 | #217 | Tragic 95.4% |
| Dutch West Indians | 8.1 /100 | #218 | Tragic 95.4% |
| Spanish Americans | 8.0 /100 | #219 | Tragic 95.4% |
| Immigrants | Southern Europe | 7.7 /100 | #220 | Tragic 95.3% |
| Immigrants | Syria | 7.4 /100 | #221 | Tragic 95.3% |
| Immigrants | Malaysia | 7.3 /100 | #222 | Tragic 95.3% |
| Immigrants | Oceania | 7.1 /100 | #223 | Tragic 95.3% |