Mongolian vs Immigrants from Zimbabwe Single Male Poverty
COMPARE
Mongolian
Immigrants from Zimbabwe
Single Male Poverty
Single Male Poverty Comparison
Mongolians
Immigrants from Zimbabwe
12.2%
SINGLE MALE POVERTY
97.7/ 100
METRIC RATING
95th/ 347
METRIC RANK
12.6%
SINGLE MALE POVERTY
78.0/ 100
METRIC RATING
140th/ 347
METRIC RANK
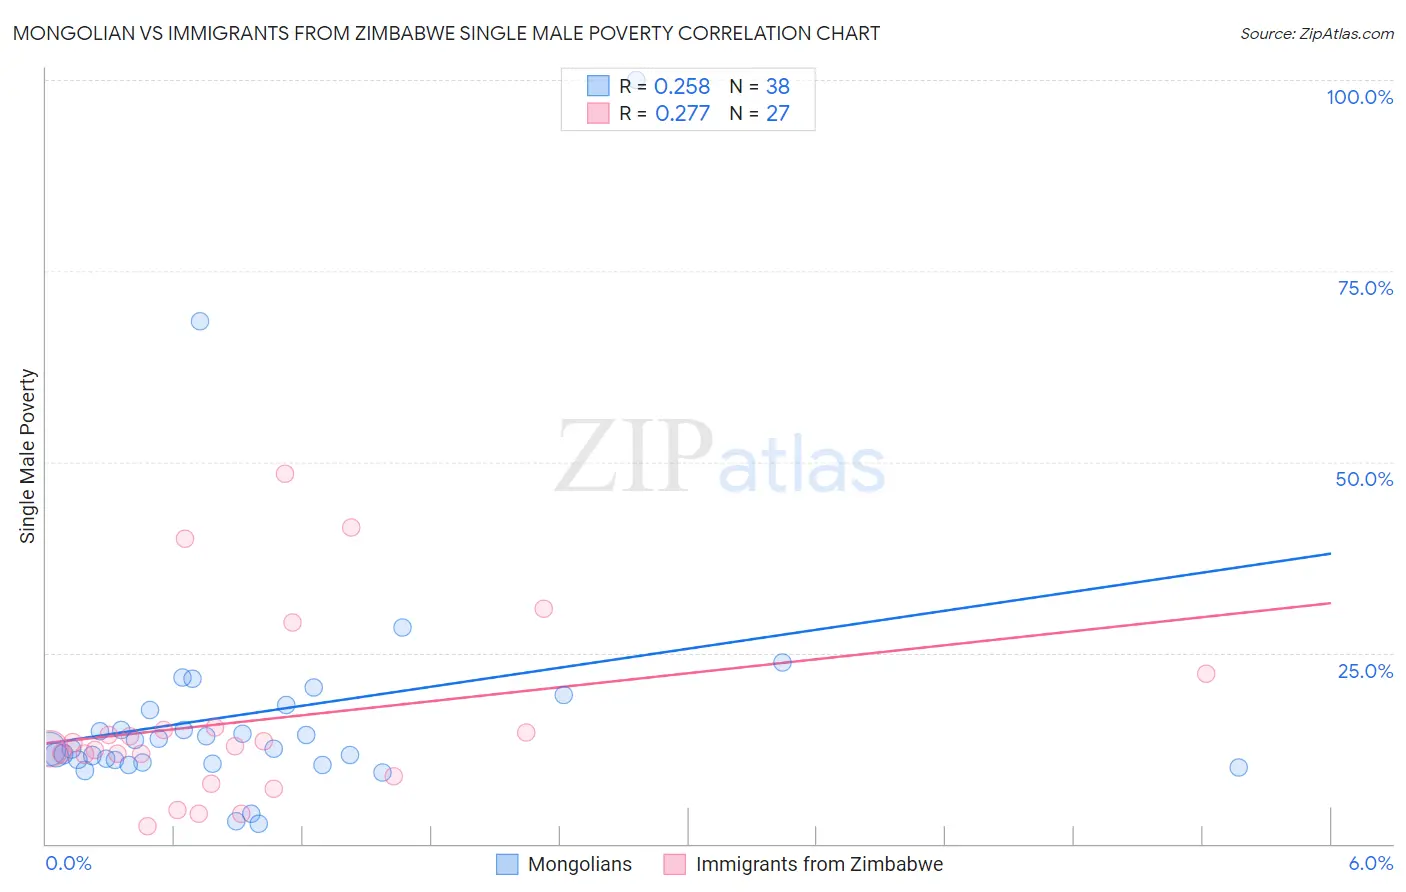
Mongolian vs Immigrants from Zimbabwe Single Male Poverty Correlation Chart
The statistical analysis conducted on geographies consisting of 132,546,705 people shows a weak positive correlation between the proportion of Mongolians and poverty level among single males in the United States with a correlation coefficient (R) of 0.258 and weighted average of 12.2%. Similarly, the statistical analysis conducted on geographies consisting of 112,161,655 people shows a weak positive correlation between the proportion of Immigrants from Zimbabwe and poverty level among single males in the United States with a correlation coefficient (R) of 0.277 and weighted average of 12.6%, a difference of 3.5%.
Single Male Poverty Correlation Summary
| Measurement | Mongolian | Immigrants from Zimbabwe |
| Minimum | 2.7% | 2.3% |
| Maximum | 100.0% | 48.4% |
| Range | 97.3% | 46.1% |
| Mean | 17.1% | 16.1% |
| Median | 12.5% | 12.7% |
| Interquartile 25% (IQ1) | 10.7% | 8.9% |
| Interquartile 75% (IQ3) | 17.6% | 15.3% |
| Interquartile Range (IQR) | 6.9% | 6.4% |
| Standard Deviation (Sample) | 17.3% | 11.8% |
| Standard Deviation (Population) | 17.0% | 11.6% |
Similar Demographics by Single Male Poverty
Demographics Similar to Mongolians by Single Male Poverty
In terms of single male poverty, the demographic groups most similar to Mongolians are Colombian (12.2%, a difference of 0.010%), Immigrants from Bosnia and Herzegovina (12.1%, a difference of 0.13%), Immigrants from Sweden (12.2%, a difference of 0.15%), Spanish American Indian (12.1%, a difference of 0.19%), and Immigrants from Italy (12.2%, a difference of 0.20%).
| Demographics | Rating | Rank | Single Male Poverty |
| Immigrants | Eritrea | 98.5 /100 | #88 | Exceptional 12.1% |
| Immigrants | Ireland | 98.3 /100 | #89 | Exceptional 12.1% |
| South American Indians | 98.3 /100 | #90 | Exceptional 12.1% |
| Immigrants | Turkey | 98.2 /100 | #91 | Exceptional 12.1% |
| Spanish American Indians | 98.0 /100 | #92 | Exceptional 12.1% |
| Immigrants | Bosnia and Herzegovina | 97.9 /100 | #93 | Exceptional 12.1% |
| Colombians | 97.8 /100 | #94 | Exceptional 12.2% |
| Mongolians | 97.7 /100 | #95 | Exceptional 12.2% |
| Immigrants | Sweden | 97.5 /100 | #96 | Exceptional 12.2% |
| Immigrants | Italy | 97.4 /100 | #97 | Exceptional 12.2% |
| Guamanians/Chamorros | 97.4 /100 | #98 | Exceptional 12.2% |
| Immigrants | Cuba | 97.3 /100 | #99 | Exceptional 12.2% |
| Immigrants | Australia | 97.1 /100 | #100 | Exceptional 12.2% |
| Immigrants | Latvia | 97.0 /100 | #101 | Exceptional 12.2% |
| Immigrants | Europe | 97.0 /100 | #102 | Exceptional 12.2% |
Demographics Similar to Immigrants from Zimbabwe by Single Male Poverty
In terms of single male poverty, the demographic groups most similar to Immigrants from Zimbabwe are Cuban (12.6%, a difference of 0.15%), Immigrants from El Salvador (12.6%, a difference of 0.16%), Okinawan (12.6%, a difference of 0.16%), Immigrants from Uganda (12.6%, a difference of 0.16%), and Immigrants from France (12.6%, a difference of 0.17%).
| Demographics | Rating | Rank | Single Male Poverty |
| Immigrants | Western Asia | 83.4 /100 | #133 | Excellent 12.5% |
| Immigrants | Ecuador | 82.1 /100 | #134 | Excellent 12.5% |
| Immigrants | Costa Rica | 81.9 /100 | #135 | Excellent 12.5% |
| Immigrants | Austria | 81.9 /100 | #136 | Excellent 12.5% |
| Ukrainians | 80.7 /100 | #137 | Excellent 12.6% |
| Immigrants | El Salvador | 80.0 /100 | #138 | Excellent 12.6% |
| Cubans | 79.9 /100 | #139 | Good 12.6% |
| Immigrants | Zimbabwe | 78.0 /100 | #140 | Good 12.6% |
| Okinawans | 75.9 /100 | #141 | Good 12.6% |
| Immigrants | Uganda | 75.9 /100 | #142 | Good 12.6% |
| Immigrants | France | 75.8 /100 | #143 | Good 12.6% |
| Hawaiians | 75.1 /100 | #144 | Good 12.6% |
| Immigrants | Lebanon | 75.0 /100 | #145 | Good 12.6% |
| Native Hawaiians | 75.0 /100 | #146 | Good 12.6% |
| Malaysians | 74.8 /100 | #147 | Good 12.6% |