Celtic vs Scandinavian Unemployment Among Seniors over 65 years
COMPARE
Celtic
Scandinavian
Unemployment Among Seniors over 65 years
Unemployment Among Seniors over 65 years Comparison
Celtics
Scandinavians
5.0%
UNEMPLOYMENT AMONG SENIORS OVER 65 YEARS
91.3/ 100
METRIC RATING
115th/ 347
METRIC RANK
4.9%
UNEMPLOYMENT AMONG SENIORS OVER 65 YEARS
99.8/ 100
METRIC RATING
58th/ 347
METRIC RANK
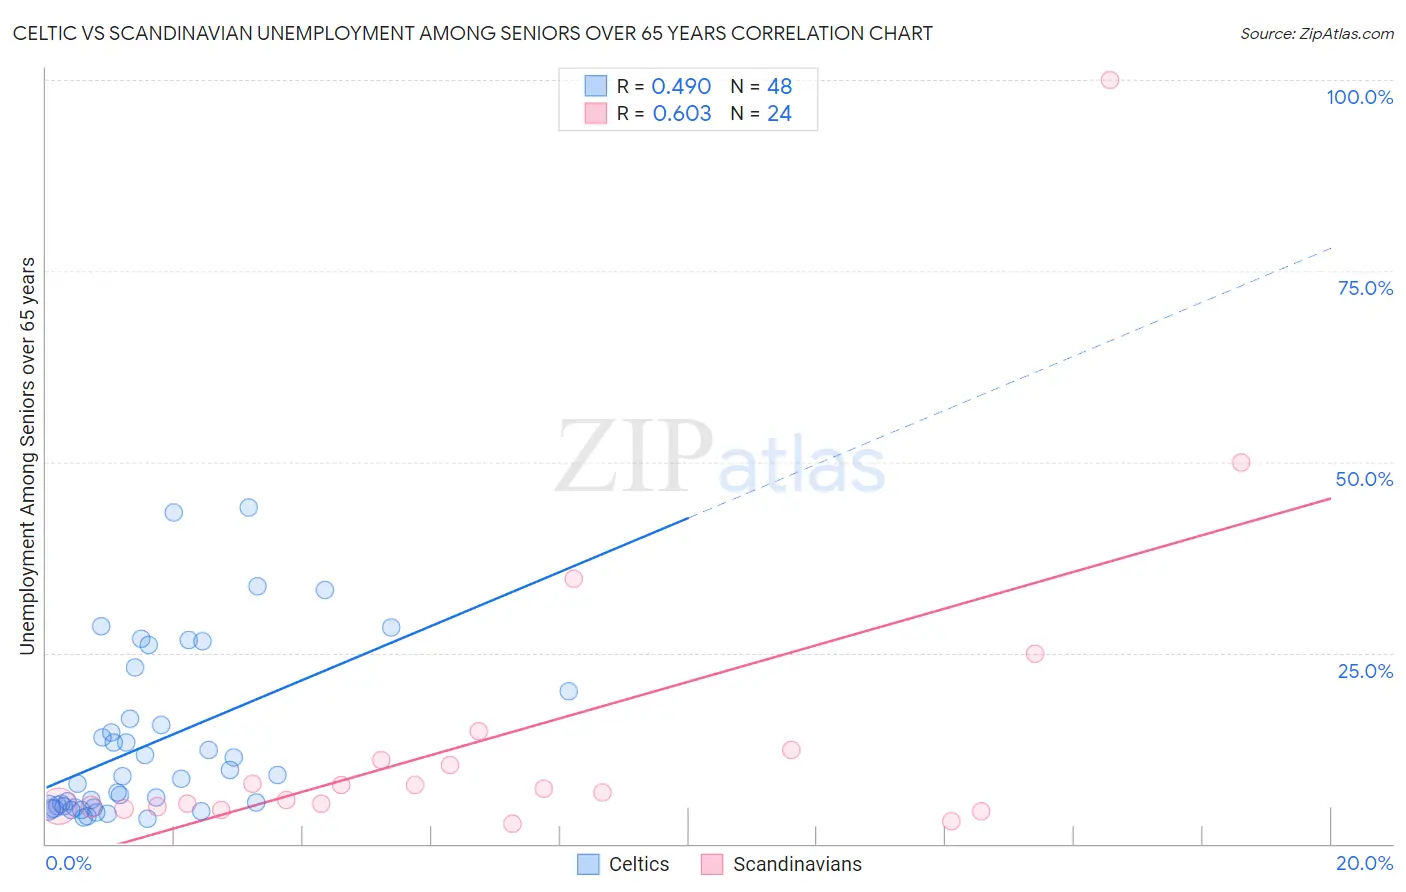
Celtic vs Scandinavian Unemployment Among Seniors over 65 years Correlation Chart
The statistical analysis conducted on geographies consisting of 157,481,769 people shows a moderate positive correlation between the proportion of Celtics and unemployment rate amomg seniors over the age of 65 in the United States with a correlation coefficient (R) of 0.490 and weighted average of 5.0%. Similarly, the statistical analysis conducted on geographies consisting of 401,897,876 people shows a significant positive correlation between the proportion of Scandinavians and unemployment rate amomg seniors over the age of 65 in the United States with a correlation coefficient (R) of 0.603 and weighted average of 4.9%, a difference of 3.3%.
Unemployment Among Seniors over 65 years Correlation Summary
| Measurement | Celtic | Scandinavian |
| Minimum | 3.2% | 2.6% |
| Maximum | 44.1% | 100.0% |
| Range | 40.9% | 97.4% |
| Mean | 13.2% | 14.3% |
| Median | 8.7% | 6.9% |
| Interquartile 25% (IQ1) | 4.8% | 4.8% |
| Interquartile 75% (IQ3) | 18.1% | 11.6% |
| Interquartile Range (IQR) | 13.4% | 6.8% |
| Standard Deviation (Sample) | 11.0% | 21.3% |
| Standard Deviation (Population) | 10.9% | 20.9% |
Similar Demographics by Unemployment Among Seniors over 65 years
Demographics Similar to Celtics by Unemployment Among Seniors over 65 years
In terms of unemployment among seniors over 65 years, the demographic groups most similar to Celtics are Seminole (5.0%, a difference of 0.010%), Immigrants from Latvia (5.0%, a difference of 0.010%), Immigrants from Korea (5.0%, a difference of 0.030%), Eastern European (5.0%, a difference of 0.070%), and Malaysian (5.1%, a difference of 0.090%).
| Demographics | Rating | Rank | Unemployment Among Seniors over 65 years |
| Immigrants | Vietnam | 92.9 /100 | #108 | Exceptional 5.0% |
| Immigrants | Malaysia | 92.7 /100 | #109 | Exceptional 5.0% |
| Immigrants | Saudi Arabia | 92.7 /100 | #110 | Exceptional 5.0% |
| Finns | 92.2 /100 | #111 | Exceptional 5.0% |
| Eastern Europeans | 92.0 /100 | #112 | Exceptional 5.0% |
| Seminole | 91.4 /100 | #113 | Exceptional 5.0% |
| Immigrants | Latvia | 91.4 /100 | #114 | Exceptional 5.0% |
| Celtics | 91.3 /100 | #115 | Exceptional 5.0% |
| Immigrants | Korea | 91.0 /100 | #116 | Exceptional 5.0% |
| Malaysians | 90.4 /100 | #117 | Exceptional 5.1% |
| Soviet Union | 90.1 /100 | #118 | Exceptional 5.1% |
| Immigrants | Canada | 89.7 /100 | #119 | Excellent 5.1% |
| Irish | 88.8 /100 | #120 | Excellent 5.1% |
| Puget Sound Salish | 88.7 /100 | #121 | Excellent 5.1% |
| Immigrants | Cameroon | 88.6 /100 | #122 | Excellent 5.1% |
Demographics Similar to Scandinavians by Unemployment Among Seniors over 65 years
In terms of unemployment among seniors over 65 years, the demographic groups most similar to Scandinavians are Danish (4.9%, a difference of 0.010%), Carpatho Rusyn (4.9%, a difference of 0.060%), European (4.9%, a difference of 0.11%), Immigrants from Iraq (4.9%, a difference of 0.12%), and Immigrants from Sudan (4.9%, a difference of 0.18%).
| Demographics | Rating | Rank | Unemployment Among Seniors over 65 years |
| Scotch-Irish | 99.9 /100 | #51 | Exceptional 4.9% |
| Swedes | 99.9 /100 | #52 | Exceptional 4.9% |
| Immigrants | Sudan | 99.8 /100 | #53 | Exceptional 4.9% |
| Immigrants | Iraq | 99.8 /100 | #54 | Exceptional 4.9% |
| Europeans | 99.8 /100 | #55 | Exceptional 4.9% |
| Carpatho Rusyns | 99.8 /100 | #56 | Exceptional 4.9% |
| Danes | 99.8 /100 | #57 | Exceptional 4.9% |
| Scandinavians | 99.8 /100 | #58 | Exceptional 4.9% |
| Immigrants | Eastern Africa | 99.7 /100 | #59 | Exceptional 4.9% |
| Immigrants | Middle Africa | 99.7 /100 | #60 | Exceptional 4.9% |
| Northern Europeans | 99.7 /100 | #61 | Exceptional 4.9% |
| Latvians | 99.6 /100 | #62 | Exceptional 4.9% |
| Croatians | 99.6 /100 | #63 | Exceptional 4.9% |
| Immigrants | Cambodia | 99.6 /100 | #64 | Exceptional 4.9% |
| Immigrants | Nicaragua | 99.6 /100 | #65 | Exceptional 4.9% |