Celtic vs Scandinavian Unemployment Among Ages 25 to 29 years
COMPARE
Celtic
Scandinavian
Unemployment Among Ages 25 to 29 years
Unemployment Among Ages 25 to 29 years Comparison
Celtics
Scandinavians
6.9%
UNEMPLOYMENT AMONG AGES 25 TO 29 YEARS
7.6/ 100
METRIC RATING
223rd/ 347
METRIC RANK
6.3%
UNEMPLOYMENT AMONG AGES 25 TO 29 YEARS
97.4/ 100
METRIC RATING
72nd/ 347
METRIC RANK
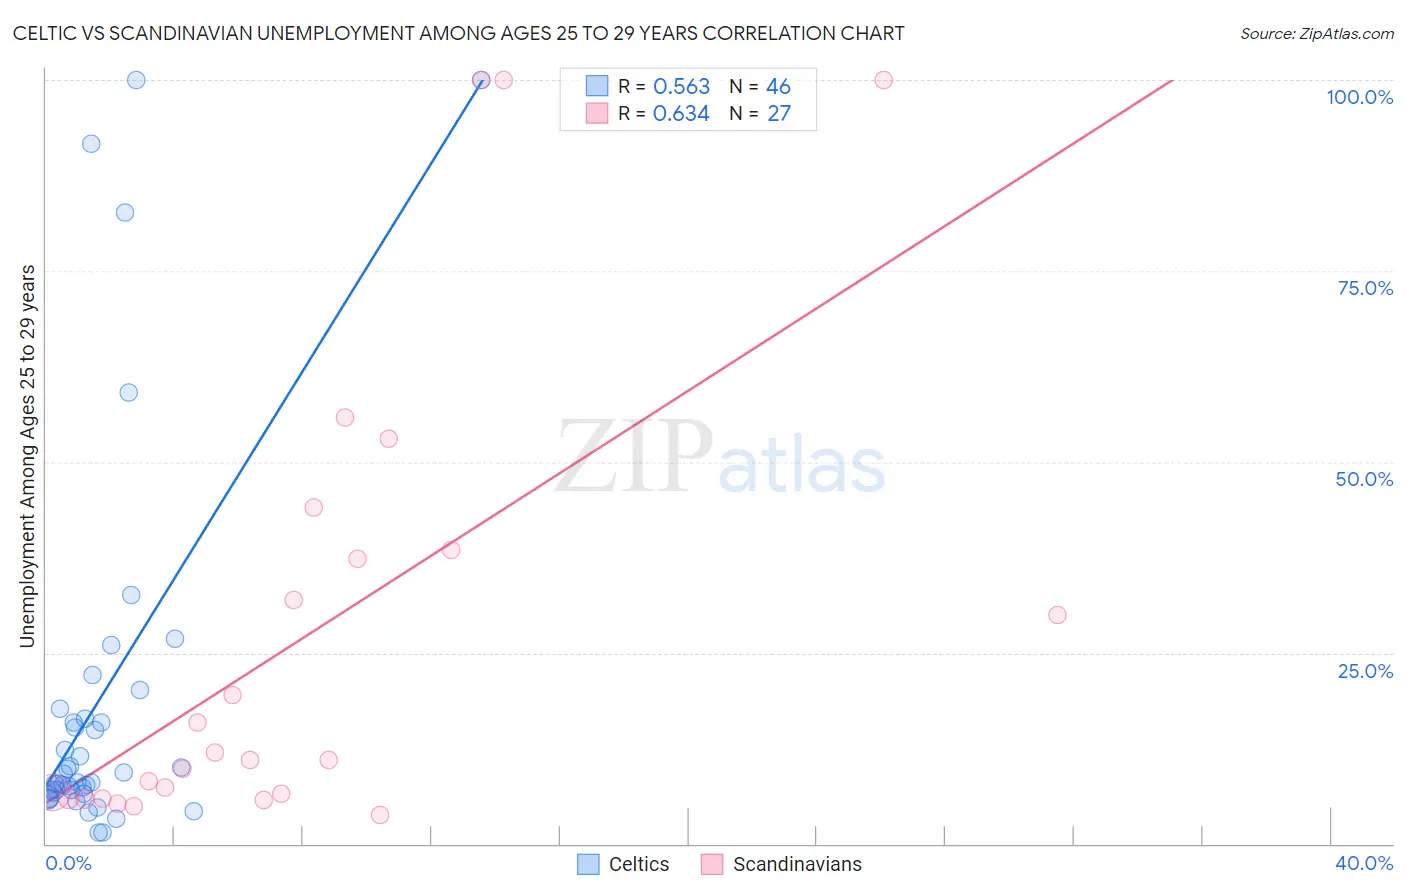
Celtic vs Scandinavian Unemployment Among Ages 25 to 29 years Correlation Chart
The statistical analysis conducted on geographies consisting of 163,916,809 people shows a substantial positive correlation between the proportion of Celtics and unemployment rate among population between the ages 25 and 29 in the United States with a correlation coefficient (R) of 0.563 and weighted average of 6.9%. Similarly, the statistical analysis conducted on geographies consisting of 433,811,713 people shows a significant positive correlation between the proportion of Scandinavians and unemployment rate among population between the ages 25 and 29 in the United States with a correlation coefficient (R) of 0.634 and weighted average of 6.3%, a difference of 10.0%.
Unemployment Among Ages 25 to 29 years Correlation Summary
| Measurement | Celtic | Scandinavian |
| Minimum | 1.4% | 3.8% |
| Maximum | 100.0% | 100.0% |
| Range | 98.6% | 96.2% |
| Mean | 18.9% | 27.3% |
| Median | 8.6% | 11.0% |
| Interquartile 25% (IQ1) | 6.8% | 6.0% |
| Interquartile 75% (IQ3) | 16.4% | 38.5% |
| Interquartile Range (IQR) | 9.6% | 32.5% |
| Standard Deviation (Sample) | 25.3% | 30.5% |
| Standard Deviation (Population) | 25.1% | 29.9% |
Similar Demographics by Unemployment Among Ages 25 to 29 years
Demographics Similar to Celtics by Unemployment Among Ages 25 to 29 years
In terms of unemployment among ages 25 to 29 years, the demographic groups most similar to Celtics are Spaniard (6.9%, a difference of 0.010%), Immigrants (6.9%, a difference of 0.33%), Israeli (6.9%, a difference of 0.40%), French (6.9%, a difference of 0.52%), and White/Caucasian (6.9%, a difference of 0.53%).
| Demographics | Rating | Rank | Unemployment Among Ages 25 to 29 years |
| Slovaks | 14.3 /100 | #216 | Poor 6.8% |
| Ute | 13.4 /100 | #217 | Poor 6.8% |
| Immigrants | Austria | 12.3 /100 | #218 | Poor 6.8% |
| Whites/Caucasians | 10.6 /100 | #219 | Poor 6.9% |
| French | 10.5 /100 | #220 | Poor 6.9% |
| Israelis | 9.8 /100 | #221 | Tragic 6.9% |
| Spaniards | 7.7 /100 | #222 | Tragic 6.9% |
| Celtics | 7.6 /100 | #223 | Tragic 6.9% |
| Immigrants | Immigrants | 6.2 /100 | #224 | Tragic 6.9% |
| Japanese | 5.4 /100 | #225 | Tragic 6.9% |
| Immigrants | Liberia | 4.8 /100 | #226 | Tragic 7.0% |
| Salvadorans | 4.4 /100 | #227 | Tragic 7.0% |
| Immigrants | Panama | 4.2 /100 | #228 | Tragic 7.0% |
| Bermudans | 3.8 /100 | #229 | Tragic 7.0% |
| Immigrants | El Salvador | 3.6 /100 | #230 | Tragic 7.0% |
Demographics Similar to Scandinavians by Unemployment Among Ages 25 to 29 years
In terms of unemployment among ages 25 to 29 years, the demographic groups most similar to Scandinavians are Immigrants from France (6.3%, a difference of 0.020%), Immigrants from Malaysia (6.3%, a difference of 0.060%), Immigrants from Hong Kong (6.3%, a difference of 0.080%), Belgian (6.3%, a difference of 0.25%), and Palestinian (6.3%, a difference of 0.26%).
| Demographics | Rating | Rank | Unemployment Among Ages 25 to 29 years |
| Immigrants | Lebanon | 97.8 /100 | #65 | Exceptional 6.3% |
| Indians (Asian) | 97.8 /100 | #66 | Exceptional 6.3% |
| Immigrants | Northern Africa | 97.8 /100 | #67 | Exceptional 6.3% |
| Palestinians | 97.7 /100 | #68 | Exceptional 6.3% |
| Immigrants | Hong Kong | 97.5 /100 | #69 | Exceptional 6.3% |
| Immigrants | Malaysia | 97.5 /100 | #70 | Exceptional 6.3% |
| Immigrants | France | 97.4 /100 | #71 | Exceptional 6.3% |
| Scandinavians | 97.4 /100 | #72 | Exceptional 6.3% |
| Belgians | 97.0 /100 | #73 | Exceptional 6.3% |
| Carpatho Rusyns | 96.9 /100 | #74 | Exceptional 6.3% |
| Immigrants | Jordan | 96.8 /100 | #75 | Exceptional 6.3% |
| Immigrants | Korea | 96.7 /100 | #76 | Exceptional 6.3% |
| Icelanders | 96.6 /100 | #77 | Exceptional 6.3% |
| Asians | 96.4 /100 | #78 | Exceptional 6.3% |
| Immigrants | Switzerland | 96.0 /100 | #79 | Exceptional 6.3% |