Apache vs Peruvian Single Male Poverty
COMPARE
Apache
Peruvian
Single Male Poverty
Single Male Poverty Comparison
Apache
Peruvians
21.6%
SINGLE MALE POVERTY
0.0/ 100
METRIC RATING
337th/ 347
METRIC RANK
11.8%
SINGLE MALE POVERTY
99.8/ 100
METRIC RATING
60th/ 347
METRIC RANK
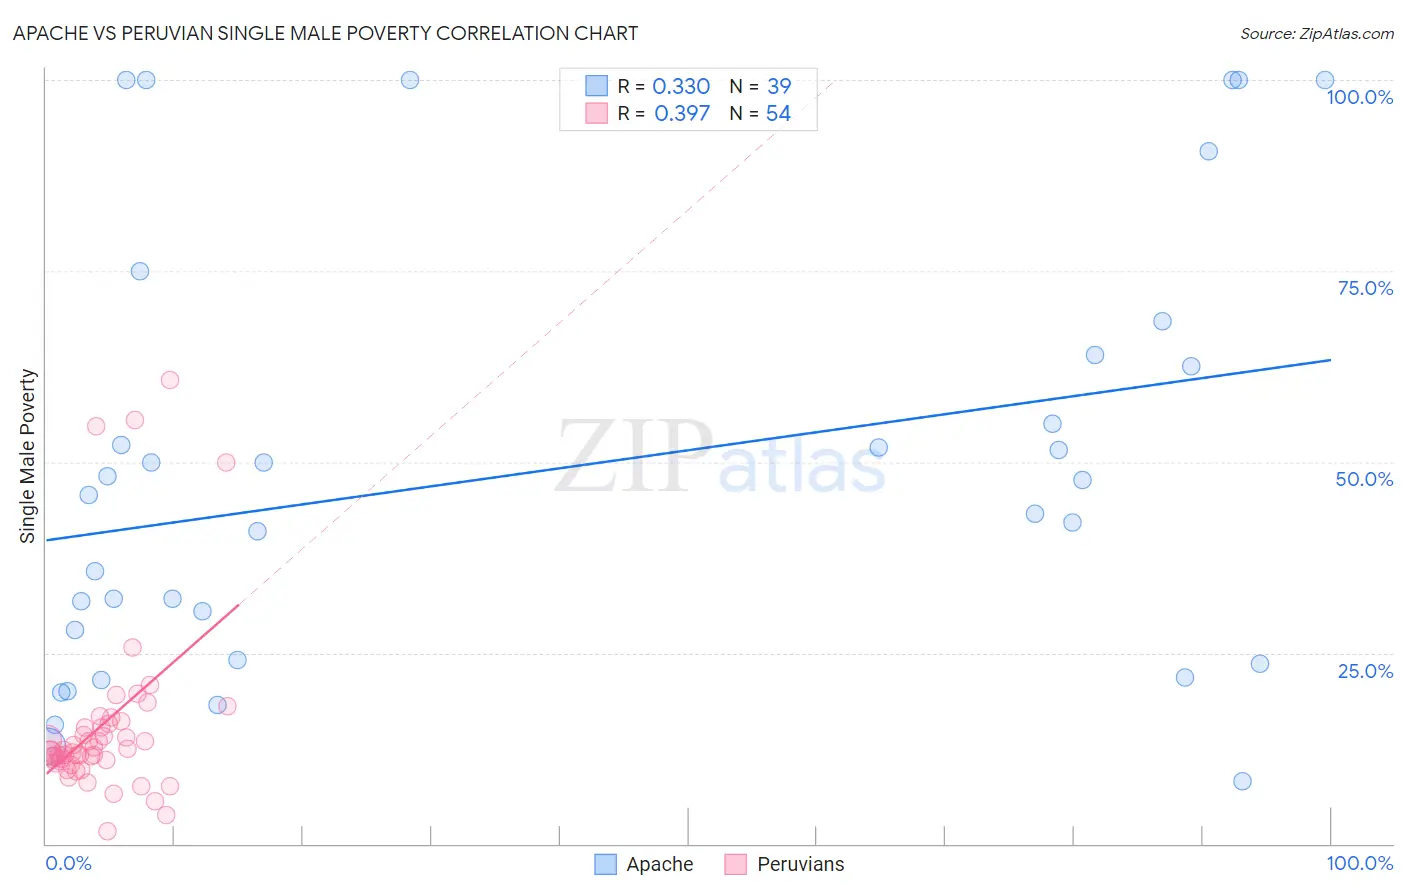
Apache vs Peruvian Single Male Poverty Correlation Chart
The statistical analysis conducted on geographies consisting of 216,687,885 people shows a mild positive correlation between the proportion of Apache and poverty level among single males in the United States with a correlation coefficient (R) of 0.330 and weighted average of 21.6%. Similarly, the statistical analysis conducted on geographies consisting of 326,481,306 people shows a mild positive correlation between the proportion of Peruvians and poverty level among single males in the United States with a correlation coefficient (R) of 0.397 and weighted average of 11.8%, a difference of 83.2%.
Single Male Poverty Correlation Summary
| Measurement | Apache | Peruvian |
| Minimum | 8.2% | 1.7% |
| Maximum | 100.0% | 60.7% |
| Range | 91.8% | 59.0% |
| Mean | 49.1% | 15.6% |
| Median | 45.6% | 12.1% |
| Interquartile 25% (IQ1) | 24.1% | 10.9% |
| Interquartile 75% (IQ3) | 64.0% | 15.7% |
| Interquartile Range (IQR) | 39.9% | 4.8% |
| Standard Deviation (Sample) | 28.3% | 12.1% |
| Standard Deviation (Population) | 27.9% | 12.0% |
Similar Demographics by Single Male Poverty
Demographics Similar to Apache by Single Male Poverty
In terms of single male poverty, the demographic groups most similar to Apache are Tohono O'odham (21.6%, a difference of 0.10%), Pueblo (21.6%, a difference of 0.18%), Yuman (21.3%, a difference of 1.3%), Arapaho (21.9%, a difference of 1.7%), and Sioux (22.2%, a difference of 2.9%).
| Demographics | Rating | Rank | Single Male Poverty |
| Cajuns | 0.0 /100 | #330 | Tragic 19.1% |
| Paiute | 0.0 /100 | #331 | Tragic 19.3% |
| Natives/Alaskans | 0.0 /100 | #332 | Tragic 19.6% |
| Inupiat | 0.0 /100 | #333 | Tragic 20.0% |
| Pima | 0.0 /100 | #334 | Tragic 20.2% |
| Yuman | 0.0 /100 | #335 | Tragic 21.3% |
| Tohono O'odham | 0.0 /100 | #336 | Tragic 21.6% |
| Apache | 0.0 /100 | #337 | Tragic 21.6% |
| Pueblo | 0.0 /100 | #338 | Tragic 21.6% |
| Arapaho | 0.0 /100 | #339 | Tragic 21.9% |
| Sioux | 0.0 /100 | #340 | Tragic 22.2% |
| Crow | 0.0 /100 | #341 | Tragic 23.3% |
| Houma | 0.0 /100 | #342 | Tragic 23.5% |
| Puerto Ricans | 0.0 /100 | #343 | Tragic 25.1% |
| Lumbee | 0.0 /100 | #344 | Tragic 25.2% |
Demographics Similar to Peruvians by Single Male Poverty
In terms of single male poverty, the demographic groups most similar to Peruvians are Cambodian (11.8%, a difference of 0.020%), Brazilian (11.8%, a difference of 0.21%), Immigrants from Brazil (11.7%, a difference of 0.29%), Immigrants from Romania (11.7%, a difference of 0.32%), and Immigrants from Sri Lanka (11.8%, a difference of 0.40%).
| Demographics | Rating | Rank | Single Male Poverty |
| Bulgarians | 99.9 /100 | #53 | Exceptional 11.7% |
| Immigrants | Uzbekistan | 99.9 /100 | #54 | Exceptional 11.7% |
| Cypriots | 99.9 /100 | #55 | Exceptional 11.7% |
| Burmese | 99.8 /100 | #56 | Exceptional 11.7% |
| Immigrants | Romania | 99.8 /100 | #57 | Exceptional 11.7% |
| Immigrants | Brazil | 99.8 /100 | #58 | Exceptional 11.7% |
| Brazilians | 99.8 /100 | #59 | Exceptional 11.8% |
| Peruvians | 99.8 /100 | #60 | Exceptional 11.8% |
| Cambodians | 99.8 /100 | #61 | Exceptional 11.8% |
| Immigrants | Sri Lanka | 99.7 /100 | #62 | Exceptional 11.8% |
| Immigrants | Belarus | 99.7 /100 | #63 | Exceptional 11.8% |
| Immigrants | Eastern Europe | 99.6 /100 | #64 | Exceptional 11.8% |
| Laotians | 99.6 /100 | #65 | Exceptional 11.9% |
| Immigrants | Uruguay | 99.6 /100 | #66 | Exceptional 11.9% |
| Immigrants | Ukraine | 99.6 /100 | #67 | Exceptional 11.9% |