Immigrants from Eritrea vs Peruvian Single Male Poverty
COMPARE
Immigrants from Eritrea
Peruvian
Single Male Poverty
Single Male Poverty Comparison
Immigrants from Eritrea
Peruvians
12.1%
SINGLE MALE POVERTY
98.5/ 100
METRIC RATING
88th/ 347
METRIC RANK
11.8%
SINGLE MALE POVERTY
99.8/ 100
METRIC RATING
60th/ 347
METRIC RANK
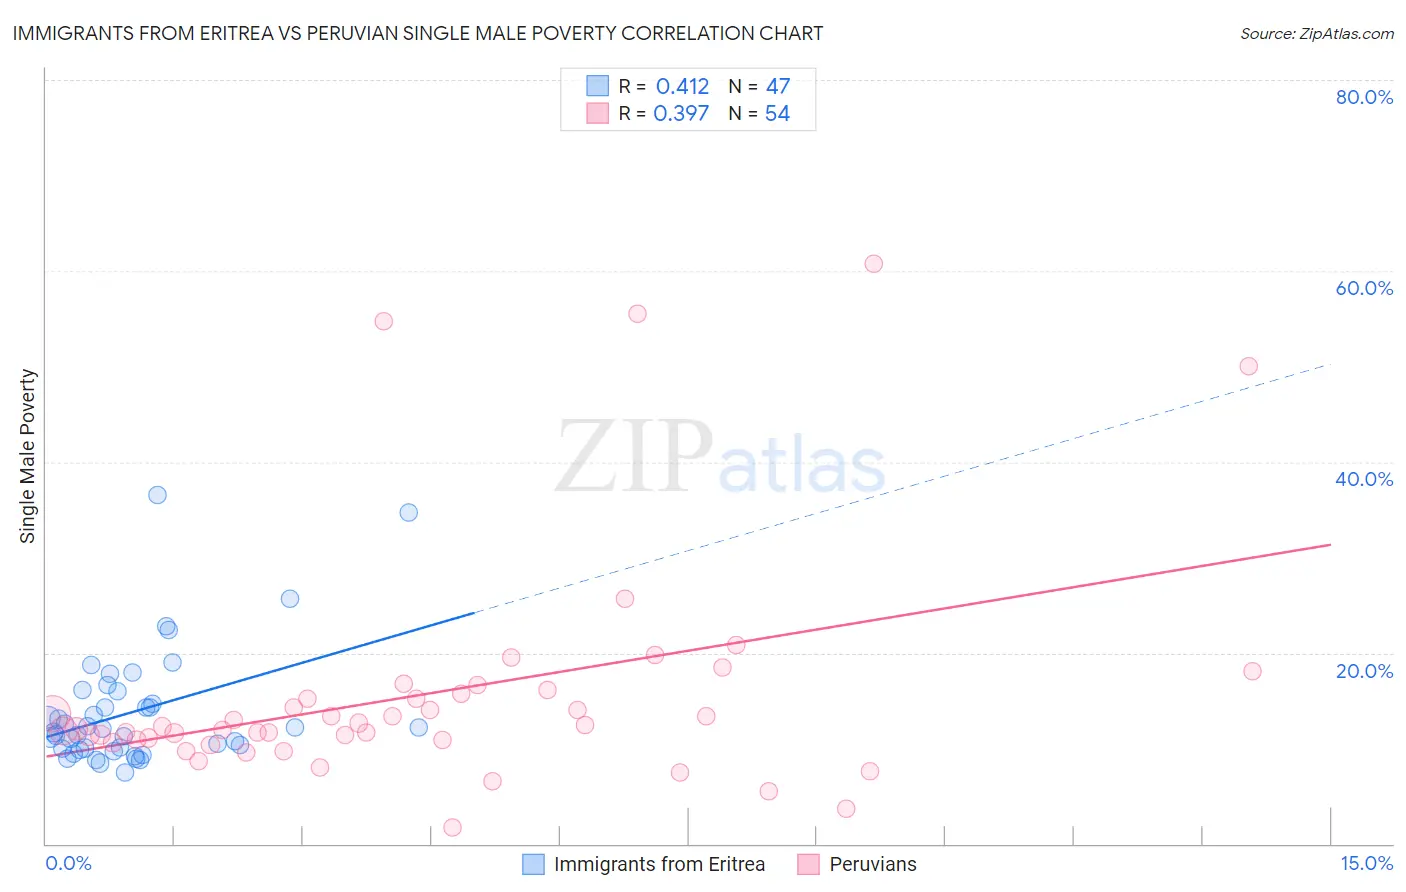
Immigrants from Eritrea vs Peruvian Single Male Poverty Correlation Chart
The statistical analysis conducted on geographies consisting of 101,335,680 people shows a moderate positive correlation between the proportion of Immigrants from Eritrea and poverty level among single males in the United States with a correlation coefficient (R) of 0.412 and weighted average of 12.1%. Similarly, the statistical analysis conducted on geographies consisting of 326,481,306 people shows a mild positive correlation between the proportion of Peruvians and poverty level among single males in the United States with a correlation coefficient (R) of 0.397 and weighted average of 11.8%, a difference of 2.7%.
Single Male Poverty Correlation Summary
| Measurement | Immigrants from Eritrea | Peruvian |
| Minimum | 7.5% | 1.7% |
| Maximum | 36.5% | 60.7% |
| Range | 29.0% | 59.0% |
| Mean | 13.9% | 15.6% |
| Median | 12.1% | 12.1% |
| Interquartile 25% (IQ1) | 10.0% | 10.9% |
| Interquartile 75% (IQ3) | 16.0% | 15.7% |
| Interquartile Range (IQR) | 6.0% | 4.8% |
| Standard Deviation (Sample) | 6.1% | 12.1% |
| Standard Deviation (Population) | 6.1% | 12.0% |
Similar Demographics by Single Male Poverty
Demographics Similar to Immigrants from Eritrea by Single Male Poverty
In terms of single male poverty, the demographic groups most similar to Immigrants from Eritrea are South American (12.1%, a difference of 0.0%), Immigrants from Israel (12.1%, a difference of 0.020%), Turkish (12.1%, a difference of 0.040%), Immigrants from Czechoslovakia (12.1%, a difference of 0.11%), and Immigrants from Colombia (12.1%, a difference of 0.14%).
| Demographics | Rating | Rank | Single Male Poverty |
| Immigrants | South America | 98.7 /100 | #81 | Exceptional 12.1% |
| Immigrants | Colombia | 98.6 /100 | #82 | Exceptional 12.1% |
| Immigrants | Chile | 98.6 /100 | #83 | Exceptional 12.1% |
| Immigrants | Czechoslovakia | 98.6 /100 | #84 | Exceptional 12.1% |
| Turks | 98.5 /100 | #85 | Exceptional 12.1% |
| Immigrants | Israel | 98.5 /100 | #86 | Exceptional 12.1% |
| South Americans | 98.5 /100 | #87 | Exceptional 12.1% |
| Immigrants | Eritrea | 98.5 /100 | #88 | Exceptional 12.1% |
| Immigrants | Ireland | 98.3 /100 | #89 | Exceptional 12.1% |
| South American Indians | 98.3 /100 | #90 | Exceptional 12.1% |
| Immigrants | Turkey | 98.2 /100 | #91 | Exceptional 12.1% |
| Spanish American Indians | 98.0 /100 | #92 | Exceptional 12.1% |
| Immigrants | Bosnia and Herzegovina | 97.9 /100 | #93 | Exceptional 12.1% |
| Colombians | 97.8 /100 | #94 | Exceptional 12.2% |
| Mongolians | 97.7 /100 | #95 | Exceptional 12.2% |
Demographics Similar to Peruvians by Single Male Poverty
In terms of single male poverty, the demographic groups most similar to Peruvians are Cambodian (11.8%, a difference of 0.020%), Brazilian (11.8%, a difference of 0.21%), Immigrants from Brazil (11.7%, a difference of 0.29%), Immigrants from Romania (11.7%, a difference of 0.32%), and Immigrants from Sri Lanka (11.8%, a difference of 0.40%).
| Demographics | Rating | Rank | Single Male Poverty |
| Bulgarians | 99.9 /100 | #53 | Exceptional 11.7% |
| Immigrants | Uzbekistan | 99.9 /100 | #54 | Exceptional 11.7% |
| Cypriots | 99.9 /100 | #55 | Exceptional 11.7% |
| Burmese | 99.8 /100 | #56 | Exceptional 11.7% |
| Immigrants | Romania | 99.8 /100 | #57 | Exceptional 11.7% |
| Immigrants | Brazil | 99.8 /100 | #58 | Exceptional 11.7% |
| Brazilians | 99.8 /100 | #59 | Exceptional 11.8% |
| Peruvians | 99.8 /100 | #60 | Exceptional 11.8% |
| Cambodians | 99.8 /100 | #61 | Exceptional 11.8% |
| Immigrants | Sri Lanka | 99.7 /100 | #62 | Exceptional 11.8% |
| Immigrants | Belarus | 99.7 /100 | #63 | Exceptional 11.8% |
| Immigrants | Eastern Europe | 99.6 /100 | #64 | Exceptional 11.8% |
| Laotians | 99.6 /100 | #65 | Exceptional 11.9% |
| Immigrants | Uruguay | 99.6 /100 | #66 | Exceptional 11.9% |
| Immigrants | Ukraine | 99.6 /100 | #67 | Exceptional 11.9% |