Alsatian vs Immigrants from Norway Single Female Poverty
COMPARE
Alsatian
Immigrants from Norway
Single Female Poverty
Single Female Poverty Comparison
Alsatians
Immigrants from Norway
24.5%
SINGLE FEMALE POVERTY
0.0/ 100
METRIC RATING
292nd/ 347
METRIC RANK
20.8%
SINGLE FEMALE POVERTY
63.0/ 100
METRIC RATING
167th/ 347
METRIC RANK
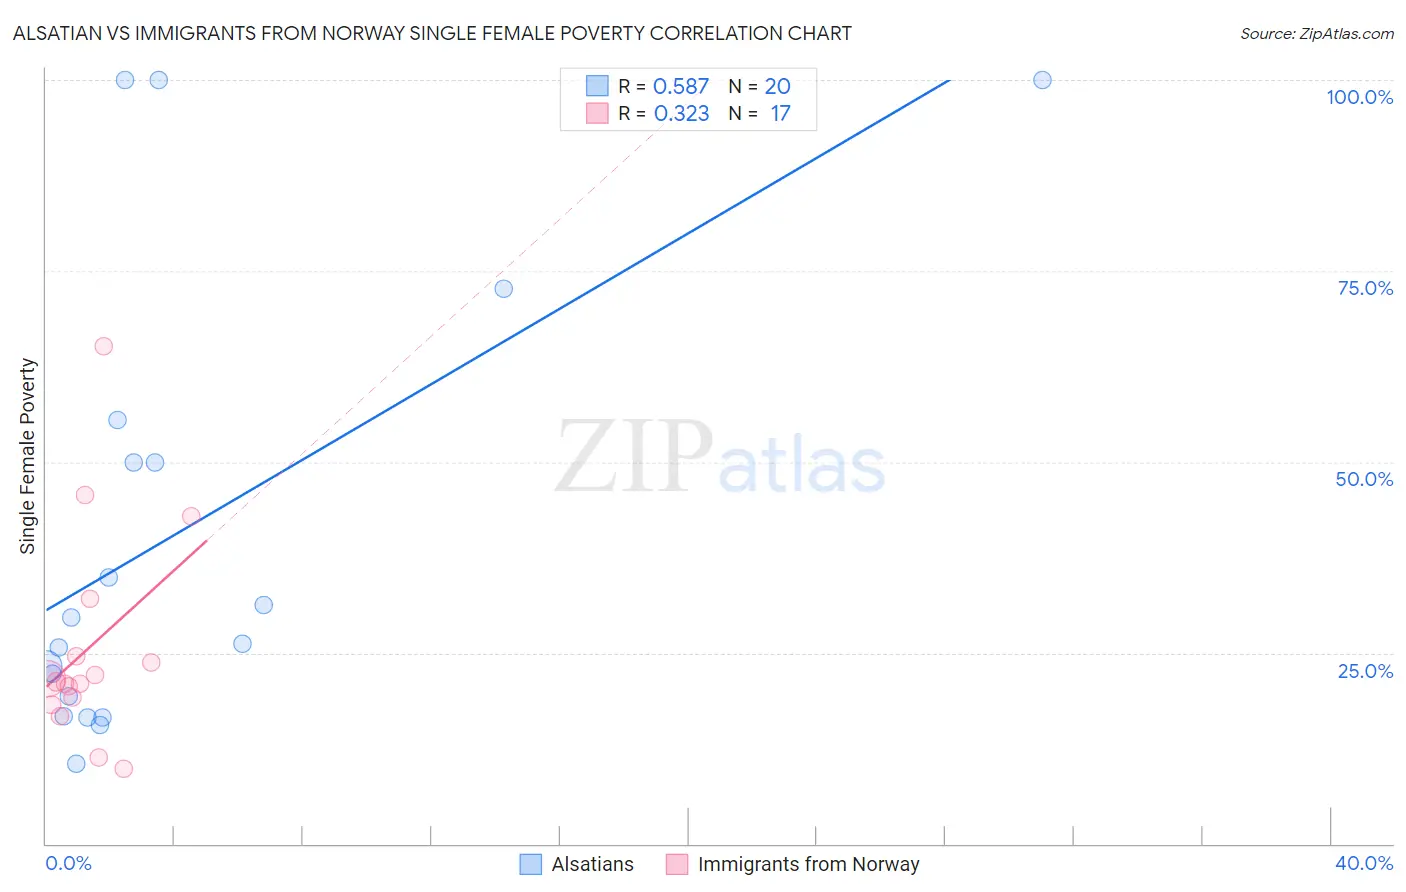
Alsatian vs Immigrants from Norway Single Female Poverty Correlation Chart
The statistical analysis conducted on geographies consisting of 82,305,024 people shows a substantial positive correlation between the proportion of Alsatians and poverty level among single females in the United States with a correlation coefficient (R) of 0.587 and weighted average of 24.5%. Similarly, the statistical analysis conducted on geographies consisting of 115,651,083 people shows a mild positive correlation between the proportion of Immigrants from Norway and poverty level among single females in the United States with a correlation coefficient (R) of 0.323 and weighted average of 20.8%, a difference of 17.6%.
Single Female Poverty Correlation Summary
| Measurement | Alsatian | Immigrants from Norway |
| Minimum | 10.5% | 9.8% |
| Maximum | 100.0% | 65.2% |
| Range | 89.5% | 55.4% |
| Mean | 40.8% | 25.7% |
| Median | 27.9% | 21.2% |
| Interquartile 25% (IQ1) | 18.1% | 18.7% |
| Interquartile 75% (IQ3) | 52.7% | 28.3% |
| Interquartile Range (IQR) | 34.6% | 9.6% |
| Standard Deviation (Sample) | 30.0% | 13.8% |
| Standard Deviation (Population) | 29.2% | 13.4% |
Similar Demographics by Single Female Poverty
Demographics Similar to Alsatians by Single Female Poverty
In terms of single female poverty, the demographic groups most similar to Alsatians are American (24.5%, a difference of 0.080%), French American Indian (24.6%, a difference of 0.23%), Osage (24.4%, a difference of 0.37%), Hispanic or Latino (24.6%, a difference of 0.57%), and Indonesian (24.3%, a difference of 0.97%).
| Demographics | Rating | Rank | Single Female Poverty |
| Immigrants | Guatemala | 0.0 /100 | #285 | Tragic 24.1% |
| Cree | 0.0 /100 | #286 | Tragic 24.1% |
| Bangladeshis | 0.0 /100 | #287 | Tragic 24.2% |
| Spanish Americans | 0.0 /100 | #288 | Tragic 24.2% |
| U.S. Virgin Islanders | 0.0 /100 | #289 | Tragic 24.2% |
| Indonesians | 0.0 /100 | #290 | Tragic 24.3% |
| Osage | 0.0 /100 | #291 | Tragic 24.4% |
| Alsatians | 0.0 /100 | #292 | Tragic 24.5% |
| Americans | 0.0 /100 | #293 | Tragic 24.5% |
| French American Indians | 0.0 /100 | #294 | Tragic 24.6% |
| Hispanics or Latinos | 0.0 /100 | #295 | Tragic 24.6% |
| Africans | 0.0 /100 | #296 | Tragic 24.8% |
| Immigrants | Central America | 0.0 /100 | #297 | Tragic 24.8% |
| Yaqui | 0.0 /100 | #298 | Tragic 24.9% |
| Mexicans | 0.0 /100 | #299 | Tragic 25.0% |
Demographics Similar to Immigrants from Norway by Single Female Poverty
In terms of single female poverty, the demographic groups most similar to Immigrants from Norway are Norwegian (20.8%, a difference of 0.0%), Ugandan (20.8%, a difference of 0.070%), Immigrants from Costa Rica (20.9%, a difference of 0.090%), Iraqi (20.8%, a difference of 0.10%), and Lebanese (20.8%, a difference of 0.32%).
| Demographics | Rating | Rank | Single Female Poverty |
| Arabs | 70.8 /100 | #160 | Good 20.7% |
| Kenyans | 68.5 /100 | #161 | Good 20.8% |
| Northern Europeans | 68.4 /100 | #162 | Good 20.8% |
| Lebanese | 67.6 /100 | #163 | Good 20.8% |
| Iraqis | 64.5 /100 | #164 | Good 20.8% |
| Ugandans | 64.0 /100 | #165 | Good 20.8% |
| Norwegians | 63.0 /100 | #166 | Good 20.8% |
| Immigrants | Norway | 63.0 /100 | #167 | Good 20.8% |
| Immigrants | Costa Rica | 61.5 /100 | #168 | Good 20.9% |
| Immigrants | Trinidad and Tobago | 56.3 /100 | #169 | Average 20.9% |
| New Zealanders | 53.2 /100 | #170 | Average 21.0% |
| Moroccans | 52.8 /100 | #171 | Average 21.0% |
| Guyanese | 52.0 /100 | #172 | Average 21.0% |
| Immigrants | Guyana | 50.6 /100 | #173 | Average 21.0% |
| Cubans | 50.0 /100 | #174 | Average 21.0% |