Celtic vs Immigrants from Nicaragua Single Father Poverty
COMPARE
Celtic
Immigrants from Nicaragua
Single Father Poverty
Single Father Poverty Comparison
Celtics
Immigrants from Nicaragua
18.5%
SINGLE FATHER POVERTY
0.0/ 100
METRIC RATING
303rd/ 347
METRIC RANK
16.2%
SINGLE FATHER POVERTY
67.8/ 100
METRIC RATING
155th/ 347
METRIC RANK
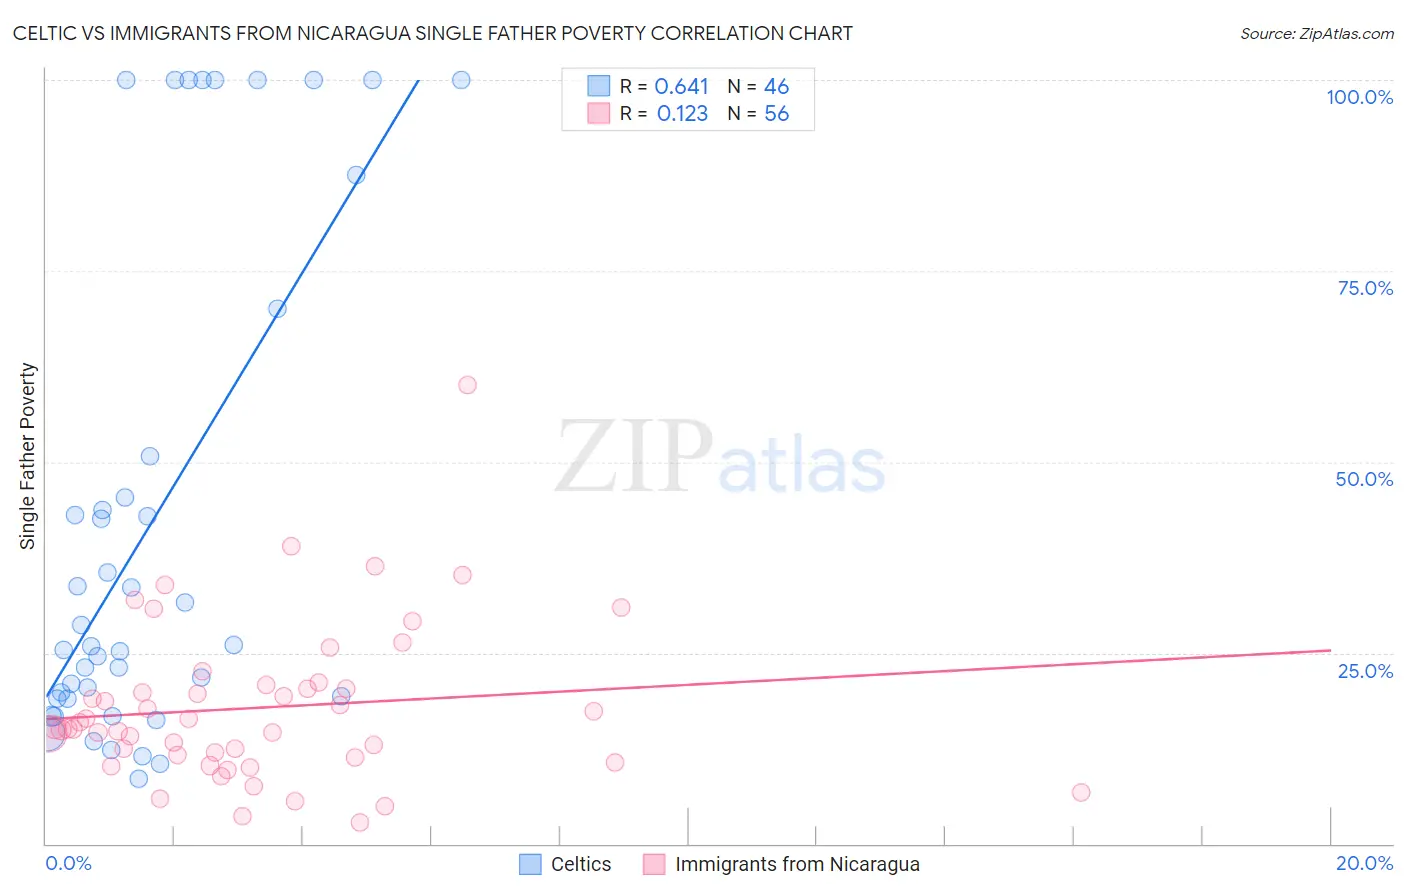
Celtic vs Immigrants from Nicaragua Single Father Poverty Correlation Chart
The statistical analysis conducted on geographies consisting of 145,202,349 people shows a significant positive correlation between the proportion of Celtics and poverty level among single fathers in the United States with a correlation coefficient (R) of 0.641 and weighted average of 18.5%. Similarly, the statistical analysis conducted on geographies consisting of 204,495,523 people shows a poor positive correlation between the proportion of Immigrants from Nicaragua and poverty level among single fathers in the United States with a correlation coefficient (R) of 0.123 and weighted average of 16.2%, a difference of 14.4%.
Single Father Poverty Correlation Summary
| Measurement | Celtic | Immigrants from Nicaragua |
| Minimum | 8.4% | 2.8% |
| Maximum | 100.0% | 60.0% |
| Range | 91.6% | 57.2% |
| Mean | 42.2% | 17.8% |
| Median | 26.0% | 15.2% |
| Interquartile 25% (IQ1) | 19.0% | 11.5% |
| Interquartile 75% (IQ3) | 50.8% | 20.6% |
| Interquartile Range (IQR) | 31.8% | 9.1% |
| Standard Deviation (Sample) | 32.4% | 10.3% |
| Standard Deviation (Population) | 32.1% | 10.2% |
Similar Demographics by Single Father Poverty
Demographics Similar to Celtics by Single Father Poverty
In terms of single father poverty, the demographic groups most similar to Celtics are Comanche (18.5%, a difference of 0.040%), Ute (18.5%, a difference of 0.14%), Hungarian (18.5%, a difference of 0.15%), Blackfeet (18.5%, a difference of 0.19%), and Immigrants from Dominican Republic (18.4%, a difference of 0.37%).
| Demographics | Rating | Rank | Single Father Poverty |
| Seminole | 0.0 /100 | #296 | Tragic 18.1% |
| French | 0.0 /100 | #297 | Tragic 18.2% |
| Africans | 0.0 /100 | #298 | Tragic 18.3% |
| Whites/Caucasians | 0.0 /100 | #299 | Tragic 18.4% |
| Immigrants | Dominican Republic | 0.0 /100 | #300 | Tragic 18.4% |
| Hungarians | 0.0 /100 | #301 | Tragic 18.5% |
| Comanche | 0.0 /100 | #302 | Tragic 18.5% |
| Celtics | 0.0 /100 | #303 | Tragic 18.5% |
| Ute | 0.0 /100 | #304 | Tragic 18.5% |
| Blackfeet | 0.0 /100 | #305 | Tragic 18.5% |
| Scotch-Irish | 0.0 /100 | #306 | Tragic 18.6% |
| French Canadians | 0.0 /100 | #307 | Tragic 18.6% |
| Ottawa | 0.0 /100 | #308 | Tragic 18.6% |
| Immigrants | Micronesia | 0.0 /100 | #309 | Tragic 18.6% |
| Chippewa | 0.0 /100 | #310 | Tragic 18.8% |
Demographics Similar to Immigrants from Nicaragua by Single Father Poverty
In terms of single father poverty, the demographic groups most similar to Immigrants from Nicaragua are Immigrants from Jordan (16.2%, a difference of 0.090%), Mexican (16.1%, a difference of 0.12%), Immigrants from Zimbabwe (16.1%, a difference of 0.22%), Immigrants from Israel (16.1%, a difference of 0.22%), and Immigrants from Czechoslovakia (16.2%, a difference of 0.25%).
| Demographics | Rating | Rank | Single Father Poverty |
| Nigerians | 76.8 /100 | #148 | Good 16.1% |
| South Africans | 75.1 /100 | #149 | Good 16.1% |
| Jordanians | 74.2 /100 | #150 | Good 16.1% |
| Immigrants | France | 73.1 /100 | #151 | Good 16.1% |
| Immigrants | Zimbabwe | 72.1 /100 | #152 | Good 16.1% |
| Immigrants | Israel | 72.0 /100 | #153 | Good 16.1% |
| Mexicans | 70.1 /100 | #154 | Good 16.1% |
| Immigrants | Nicaragua | 67.8 /100 | #155 | Good 16.2% |
| Immigrants | Jordan | 66.0 /100 | #156 | Good 16.2% |
| Immigrants | Czechoslovakia | 62.8 /100 | #157 | Good 16.2% |
| Portuguese | 62.3 /100 | #158 | Good 16.2% |
| Belizeans | 59.9 /100 | #159 | Average 16.2% |
| Immigrants | Sudan | 59.8 /100 | #160 | Average 16.2% |
| Estonians | 56.7 /100 | #161 | Average 16.2% |
| Ugandans | 55.9 /100 | #162 | Average 16.3% |