Delaware vs Immigrants from Nicaragua Single Father Poverty
COMPARE
Delaware
Immigrants from Nicaragua
Single Father Poverty
Single Father Poverty Comparison
Delaware
Immigrants from Nicaragua
18.9%
SINGLE FATHER POVERTY
0.0/ 100
METRIC RATING
314th/ 347
METRIC RANK
16.2%
SINGLE FATHER POVERTY
67.8/ 100
METRIC RATING
155th/ 347
METRIC RANK
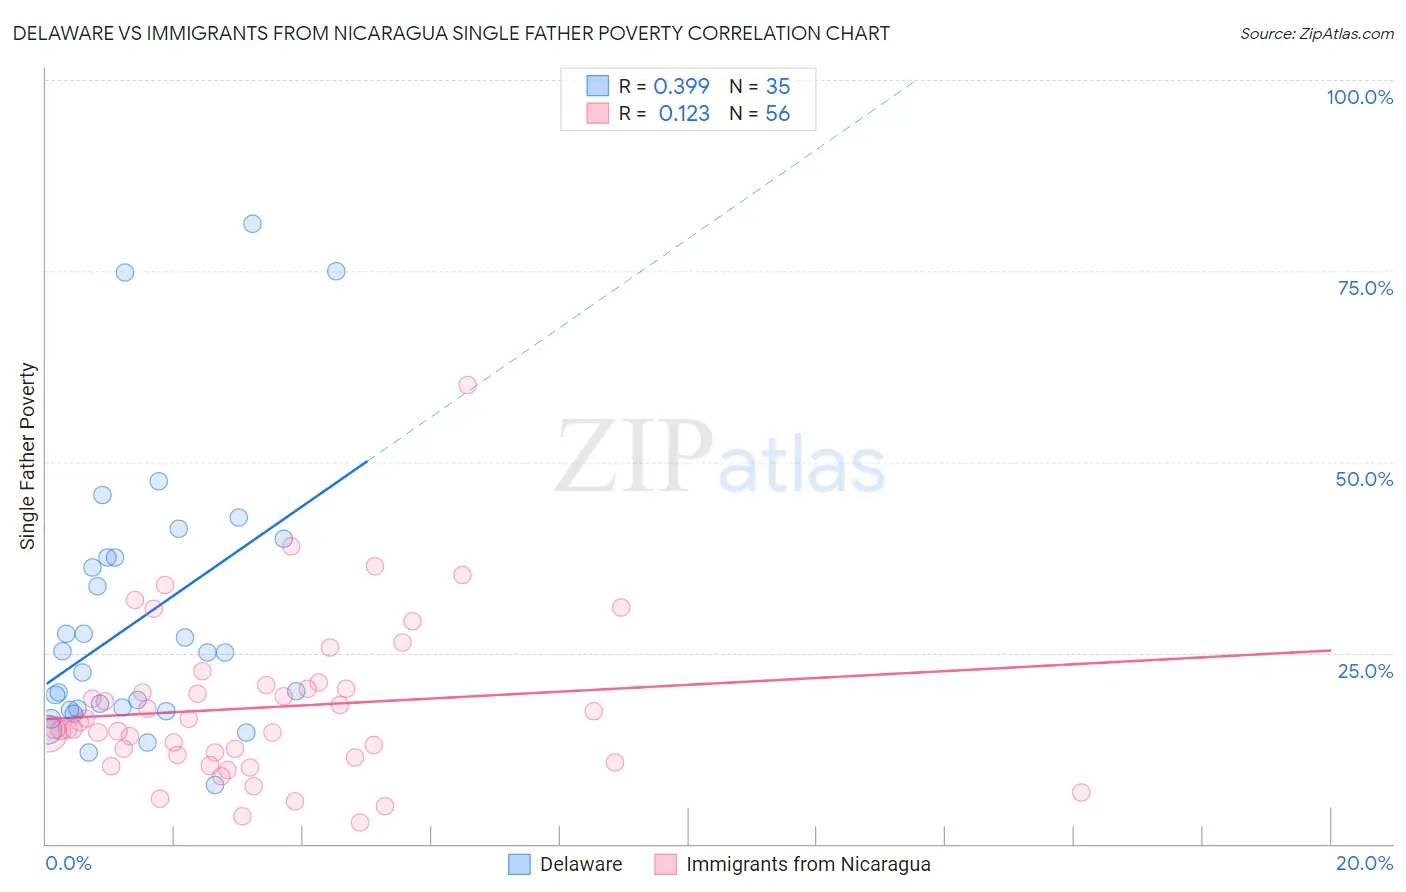
Delaware vs Immigrants from Nicaragua Single Father Poverty Correlation Chart
The statistical analysis conducted on geographies consisting of 86,574,131 people shows a mild positive correlation between the proportion of Delaware and poverty level among single fathers in the United States with a correlation coefficient (R) of 0.399 and weighted average of 18.9%. Similarly, the statistical analysis conducted on geographies consisting of 204,495,523 people shows a poor positive correlation between the proportion of Immigrants from Nicaragua and poverty level among single fathers in the United States with a correlation coefficient (R) of 0.123 and weighted average of 16.2%, a difference of 17.1%.
Single Father Poverty Correlation Summary
| Measurement | Delaware | Immigrants from Nicaragua |
| Minimum | 7.7% | 2.8% |
| Maximum | 81.2% | 60.0% |
| Range | 73.6% | 57.2% |
| Mean | 29.6% | 17.8% |
| Median | 25.0% | 15.2% |
| Interquartile 25% (IQ1) | 17.5% | 11.5% |
| Interquartile 75% (IQ3) | 37.5% | 20.6% |
| Interquartile Range (IQR) | 20.1% | 9.1% |
| Standard Deviation (Sample) | 18.0% | 10.3% |
| Standard Deviation (Population) | 17.7% | 10.2% |
Similar Demographics by Single Father Poverty
Demographics Similar to Delaware by Single Father Poverty
In terms of single father poverty, the demographic groups most similar to Delaware are Potawatomi (18.9%, a difference of 0.16%), Chickasaw (19.0%, a difference of 0.16%), Immigrants from Dominica (18.9%, a difference of 0.36%), Nonimmigrants (18.8%, a difference of 0.42%), and Osage (19.0%, a difference of 0.56%).
| Demographics | Rating | Rank | Single Father Poverty |
| French Canadians | 0.0 /100 | #307 | Tragic 18.6% |
| Ottawa | 0.0 /100 | #308 | Tragic 18.6% |
| Immigrants | Micronesia | 0.0 /100 | #309 | Tragic 18.6% |
| Chippewa | 0.0 /100 | #310 | Tragic 18.8% |
| Immigrants | Nonimmigrants | 0.0 /100 | #311 | Tragic 18.8% |
| Immigrants | Dominica | 0.0 /100 | #312 | Tragic 18.9% |
| Potawatomi | 0.0 /100 | #313 | Tragic 18.9% |
| Delaware | 0.0 /100 | #314 | Tragic 18.9% |
| Chickasaw | 0.0 /100 | #315 | Tragic 19.0% |
| Osage | 0.0 /100 | #316 | Tragic 19.0% |
| Dominicans | 0.0 /100 | #317 | Tragic 19.1% |
| Dutch West Indians | 0.0 /100 | #318 | Tragic 19.2% |
| Slovaks | 0.0 /100 | #319 | Tragic 19.3% |
| Inupiat | 0.0 /100 | #320 | Tragic 19.5% |
| Cherokee | 0.0 /100 | #321 | Tragic 19.6% |
Demographics Similar to Immigrants from Nicaragua by Single Father Poverty
In terms of single father poverty, the demographic groups most similar to Immigrants from Nicaragua are Immigrants from Jordan (16.2%, a difference of 0.090%), Mexican (16.1%, a difference of 0.12%), Immigrants from Zimbabwe (16.1%, a difference of 0.22%), Immigrants from Israel (16.1%, a difference of 0.22%), and Immigrants from Czechoslovakia (16.2%, a difference of 0.25%).
| Demographics | Rating | Rank | Single Father Poverty |
| Nigerians | 76.8 /100 | #148 | Good 16.1% |
| South Africans | 75.1 /100 | #149 | Good 16.1% |
| Jordanians | 74.2 /100 | #150 | Good 16.1% |
| Immigrants | France | 73.1 /100 | #151 | Good 16.1% |
| Immigrants | Zimbabwe | 72.1 /100 | #152 | Good 16.1% |
| Immigrants | Israel | 72.0 /100 | #153 | Good 16.1% |
| Mexicans | 70.1 /100 | #154 | Good 16.1% |
| Immigrants | Nicaragua | 67.8 /100 | #155 | Good 16.2% |
| Immigrants | Jordan | 66.0 /100 | #156 | Good 16.2% |
| Immigrants | Czechoslovakia | 62.8 /100 | #157 | Good 16.2% |
| Portuguese | 62.3 /100 | #158 | Good 16.2% |
| Belizeans | 59.9 /100 | #159 | Average 16.2% |
| Immigrants | Sudan | 59.8 /100 | #160 | Average 16.2% |
| Estonians | 56.7 /100 | #161 | Average 16.2% |
| Ugandans | 55.9 /100 | #162 | Average 16.3% |