Celtic vs Immigrants from Uruguay Single Father Poverty
COMPARE
Celtic
Immigrants from Uruguay
Single Father Poverty
Single Father Poverty Comparison
Celtics
Immigrants from Uruguay
18.5%
SINGLE FATHER POVERTY
0.0/ 100
METRIC RATING
303rd/ 347
METRIC RANK
15.6%
SINGLE FATHER POVERTY
98.2/ 100
METRIC RATING
94th/ 347
METRIC RANK
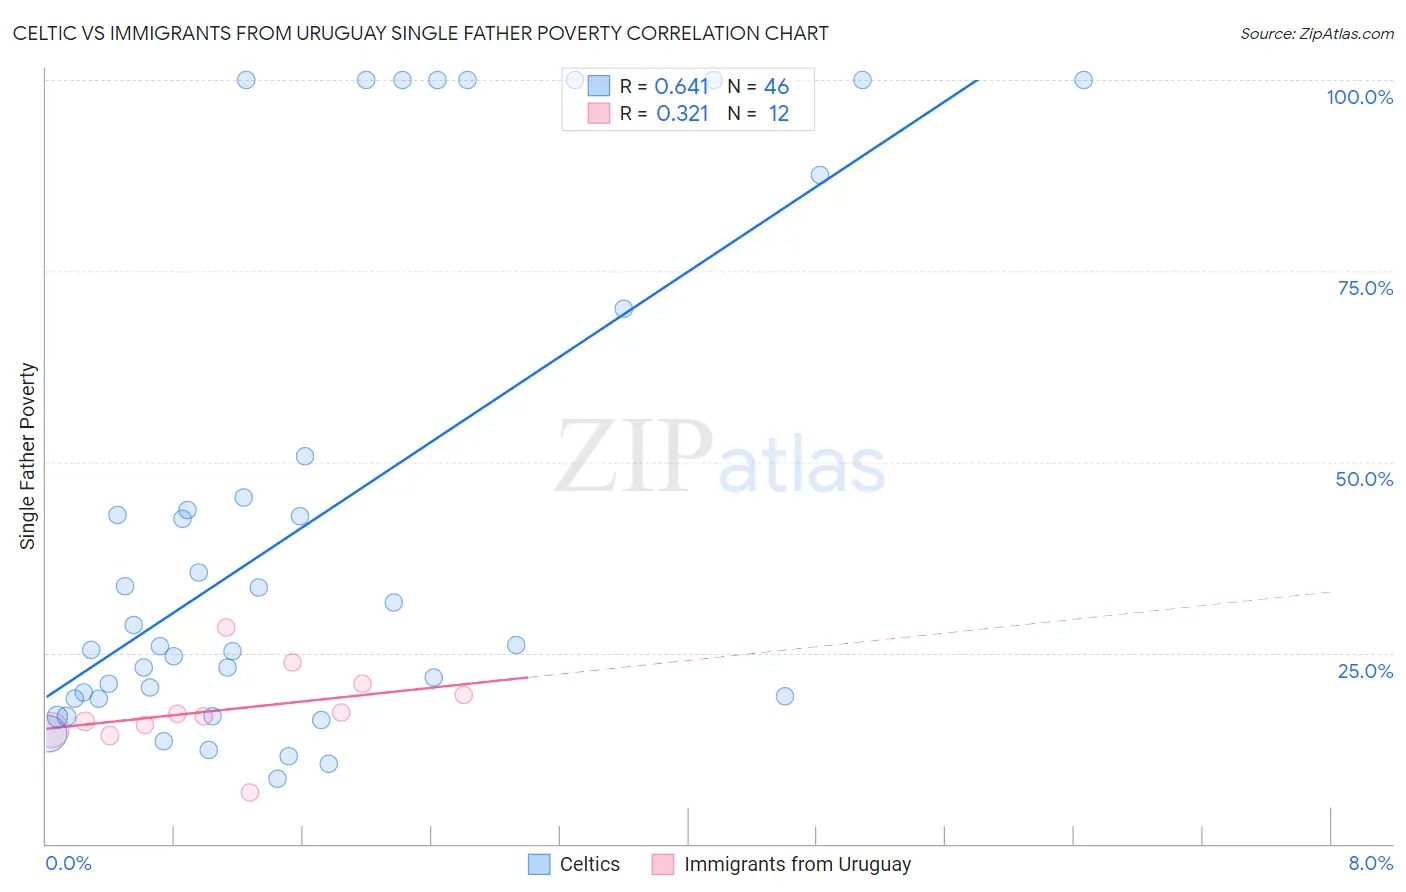
Celtic vs Immigrants from Uruguay Single Father Poverty Correlation Chart
The statistical analysis conducted on geographies consisting of 145,202,349 people shows a significant positive correlation between the proportion of Celtics and poverty level among single fathers in the United States with a correlation coefficient (R) of 0.641 and weighted average of 18.5%. Similarly, the statistical analysis conducted on geographies consisting of 118,124,397 people shows a mild positive correlation between the proportion of Immigrants from Uruguay and poverty level among single fathers in the United States with a correlation coefficient (R) of 0.321 and weighted average of 15.6%, a difference of 18.7%.
Single Father Poverty Correlation Summary
| Measurement | Celtic | Immigrants from Uruguay |
| Minimum | 8.4% | 6.7% |
| Maximum | 100.0% | 28.4% |
| Range | 91.6% | 21.7% |
| Mean | 42.2% | 17.6% |
| Median | 26.0% | 16.9% |
| Interquartile 25% (IQ1) | 19.0% | 15.2% |
| Interquartile 75% (IQ3) | 50.8% | 20.2% |
| Interquartile Range (IQR) | 31.8% | 5.0% |
| Standard Deviation (Sample) | 32.4% | 5.3% |
| Standard Deviation (Population) | 32.1% | 5.1% |
Similar Demographics by Single Father Poverty
Demographics Similar to Celtics by Single Father Poverty
In terms of single father poverty, the demographic groups most similar to Celtics are Comanche (18.5%, a difference of 0.040%), Ute (18.5%, a difference of 0.14%), Hungarian (18.5%, a difference of 0.15%), Blackfeet (18.5%, a difference of 0.19%), and Immigrants from Dominican Republic (18.4%, a difference of 0.37%).
| Demographics | Rating | Rank | Single Father Poverty |
| Seminole | 0.0 /100 | #296 | Tragic 18.1% |
| French | 0.0 /100 | #297 | Tragic 18.2% |
| Africans | 0.0 /100 | #298 | Tragic 18.3% |
| Whites/Caucasians | 0.0 /100 | #299 | Tragic 18.4% |
| Immigrants | Dominican Republic | 0.0 /100 | #300 | Tragic 18.4% |
| Hungarians | 0.0 /100 | #301 | Tragic 18.5% |
| Comanche | 0.0 /100 | #302 | Tragic 18.5% |
| Celtics | 0.0 /100 | #303 | Tragic 18.5% |
| Ute | 0.0 /100 | #304 | Tragic 18.5% |
| Blackfeet | 0.0 /100 | #305 | Tragic 18.5% |
| Scotch-Irish | 0.0 /100 | #306 | Tragic 18.6% |
| French Canadians | 0.0 /100 | #307 | Tragic 18.6% |
| Ottawa | 0.0 /100 | #308 | Tragic 18.6% |
| Immigrants | Micronesia | 0.0 /100 | #309 | Tragic 18.6% |
| Chippewa | 0.0 /100 | #310 | Tragic 18.8% |
Demographics Similar to Immigrants from Uruguay by Single Father Poverty
In terms of single father poverty, the demographic groups most similar to Immigrants from Uruguay are Immigrants from Kazakhstan (15.6%, a difference of 0.050%), Immigrants from Belgium (15.6%, a difference of 0.060%), Yaqui (15.6%, a difference of 0.070%), Zimbabwean (15.6%, a difference of 0.080%), and Basque (15.5%, a difference of 0.14%).
| Demographics | Rating | Rank | Single Father Poverty |
| Brazilians | 99.0 /100 | #87 | Exceptional 15.5% |
| Burmese | 99.0 /100 | #88 | Exceptional 15.5% |
| Immigrants | Korea | 99.0 /100 | #89 | Exceptional 15.5% |
| Mexican American Indians | 98.7 /100 | #90 | Exceptional 15.5% |
| Immigrants | Romania | 98.6 /100 | #91 | Exceptional 15.5% |
| Immigrants | Serbia | 98.5 /100 | #92 | Exceptional 15.5% |
| Basques | 98.4 /100 | #93 | Exceptional 15.5% |
| Immigrants | Uruguay | 98.2 /100 | #94 | Exceptional 15.6% |
| Immigrants | Kazakhstan | 98.2 /100 | #95 | Exceptional 15.6% |
| Immigrants | Belgium | 98.1 /100 | #96 | Exceptional 15.6% |
| Yaqui | 98.1 /100 | #97 | Exceptional 15.6% |
| Zimbabweans | 98.1 /100 | #98 | Exceptional 15.6% |
| Immigrants | Middle Africa | 97.4 /100 | #99 | Exceptional 15.6% |
| Immigrants | Chile | 96.9 /100 | #100 | Exceptional 15.7% |
| Fijians | 96.8 /100 | #101 | Exceptional 15.7% |