Celtic vs Immigrants from Japan Single Father Poverty
COMPARE
Celtic
Immigrants from Japan
Single Father Poverty
Single Father Poverty Comparison
Celtics
Immigrants from Japan
18.5%
SINGLE FATHER POVERTY
0.0/ 100
METRIC RATING
303rd/ 347
METRIC RANK
15.3%
SINGLE FATHER POVERTY
99.5/ 100
METRIC RATING
76th/ 347
METRIC RANK
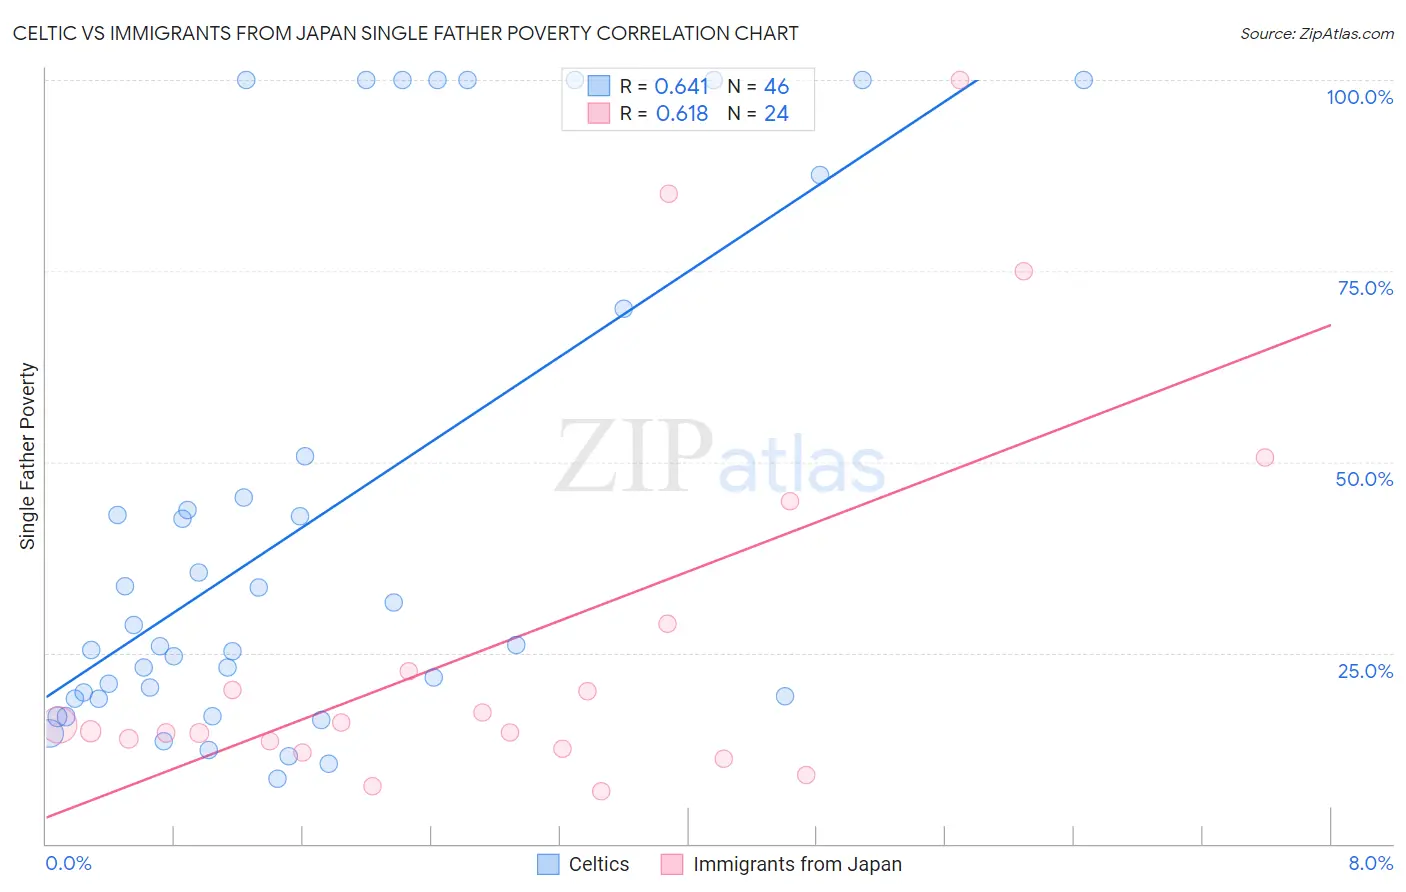
Celtic vs Immigrants from Japan Single Father Poverty Correlation Chart
The statistical analysis conducted on geographies consisting of 145,202,349 people shows a significant positive correlation between the proportion of Celtics and poverty level among single fathers in the United States with a correlation coefficient (R) of 0.641 and weighted average of 18.5%. Similarly, the statistical analysis conducted on geographies consisting of 272,248,518 people shows a significant positive correlation between the proportion of Immigrants from Japan and poverty level among single fathers in the United States with a correlation coefficient (R) of 0.618 and weighted average of 15.3%, a difference of 20.5%.
Single Father Poverty Correlation Summary
| Measurement | Celtic | Immigrants from Japan |
| Minimum | 8.4% | 7.0% |
| Maximum | 100.0% | 100.0% |
| Range | 91.6% | 93.0% |
| Mean | 42.2% | 26.7% |
| Median | 26.0% | 15.1% |
| Interquartile 25% (IQ1) | 19.0% | 12.9% |
| Interquartile 75% (IQ3) | 50.8% | 25.6% |
| Interquartile Range (IQR) | 31.8% | 12.7% |
| Standard Deviation (Sample) | 32.4% | 25.6% |
| Standard Deviation (Population) | 32.1% | 25.1% |
Similar Demographics by Single Father Poverty
Demographics Similar to Celtics by Single Father Poverty
In terms of single father poverty, the demographic groups most similar to Celtics are Comanche (18.5%, a difference of 0.040%), Ute (18.5%, a difference of 0.14%), Hungarian (18.5%, a difference of 0.15%), Blackfeet (18.5%, a difference of 0.19%), and Immigrants from Dominican Republic (18.4%, a difference of 0.37%).
| Demographics | Rating | Rank | Single Father Poverty |
| Seminole | 0.0 /100 | #296 | Tragic 18.1% |
| French | 0.0 /100 | #297 | Tragic 18.2% |
| Africans | 0.0 /100 | #298 | Tragic 18.3% |
| Whites/Caucasians | 0.0 /100 | #299 | Tragic 18.4% |
| Immigrants | Dominican Republic | 0.0 /100 | #300 | Tragic 18.4% |
| Hungarians | 0.0 /100 | #301 | Tragic 18.5% |
| Comanche | 0.0 /100 | #302 | Tragic 18.5% |
| Celtics | 0.0 /100 | #303 | Tragic 18.5% |
| Ute | 0.0 /100 | #304 | Tragic 18.5% |
| Blackfeet | 0.0 /100 | #305 | Tragic 18.5% |
| Scotch-Irish | 0.0 /100 | #306 | Tragic 18.6% |
| French Canadians | 0.0 /100 | #307 | Tragic 18.6% |
| Ottawa | 0.0 /100 | #308 | Tragic 18.6% |
| Immigrants | Micronesia | 0.0 /100 | #309 | Tragic 18.6% |
| Chippewa | 0.0 /100 | #310 | Tragic 18.8% |
Demographics Similar to Immigrants from Japan by Single Father Poverty
In terms of single father poverty, the demographic groups most similar to Immigrants from Japan are Immigrants from Peru (15.3%, a difference of 0.010%), Tlingit-Haida (15.3%, a difference of 0.060%), Immigrants from Turkey (15.3%, a difference of 0.080%), Immigrants from Northern Africa (15.3%, a difference of 0.080%), and Maltese (15.3%, a difference of 0.10%).
| Demographics | Rating | Rank | Single Father Poverty |
| Japanese | 99.7 /100 | #69 | Exceptional 15.2% |
| Mongolians | 99.7 /100 | #70 | Exceptional 15.3% |
| Immigrants | Brazil | 99.6 /100 | #71 | Exceptional 15.3% |
| Immigrants | Lithuania | 99.6 /100 | #72 | Exceptional 15.3% |
| Kenyans | 99.6 /100 | #73 | Exceptional 15.3% |
| Maltese | 99.6 /100 | #74 | Exceptional 15.3% |
| Immigrants | Turkey | 99.5 /100 | #75 | Exceptional 15.3% |
| Immigrants | Japan | 99.5 /100 | #76 | Exceptional 15.3% |
| Immigrants | Peru | 99.5 /100 | #77 | Exceptional 15.3% |
| Tlingit-Haida | 99.5 /100 | #78 | Exceptional 15.3% |
| Immigrants | Northern Africa | 99.5 /100 | #79 | Exceptional 15.3% |
| Armenians | 99.4 /100 | #80 | Exceptional 15.4% |
| Immigrants | Congo | 99.4 /100 | #81 | Exceptional 15.4% |
| Immigrants | Ukraine | 99.4 /100 | #82 | Exceptional 15.4% |
| Chinese | 99.3 /100 | #83 | Exceptional 15.4% |