Scottish vs Immigrants from Nicaragua Single Father Poverty
COMPARE
Scottish
Immigrants from Nicaragua
Single Father Poverty
Single Father Poverty Comparison
Scottish
Immigrants from Nicaragua
17.7%
SINGLE FATHER POVERTY
0.0/ 100
METRIC RATING
280th/ 347
METRIC RANK
16.2%
SINGLE FATHER POVERTY
67.8/ 100
METRIC RATING
155th/ 347
METRIC RANK
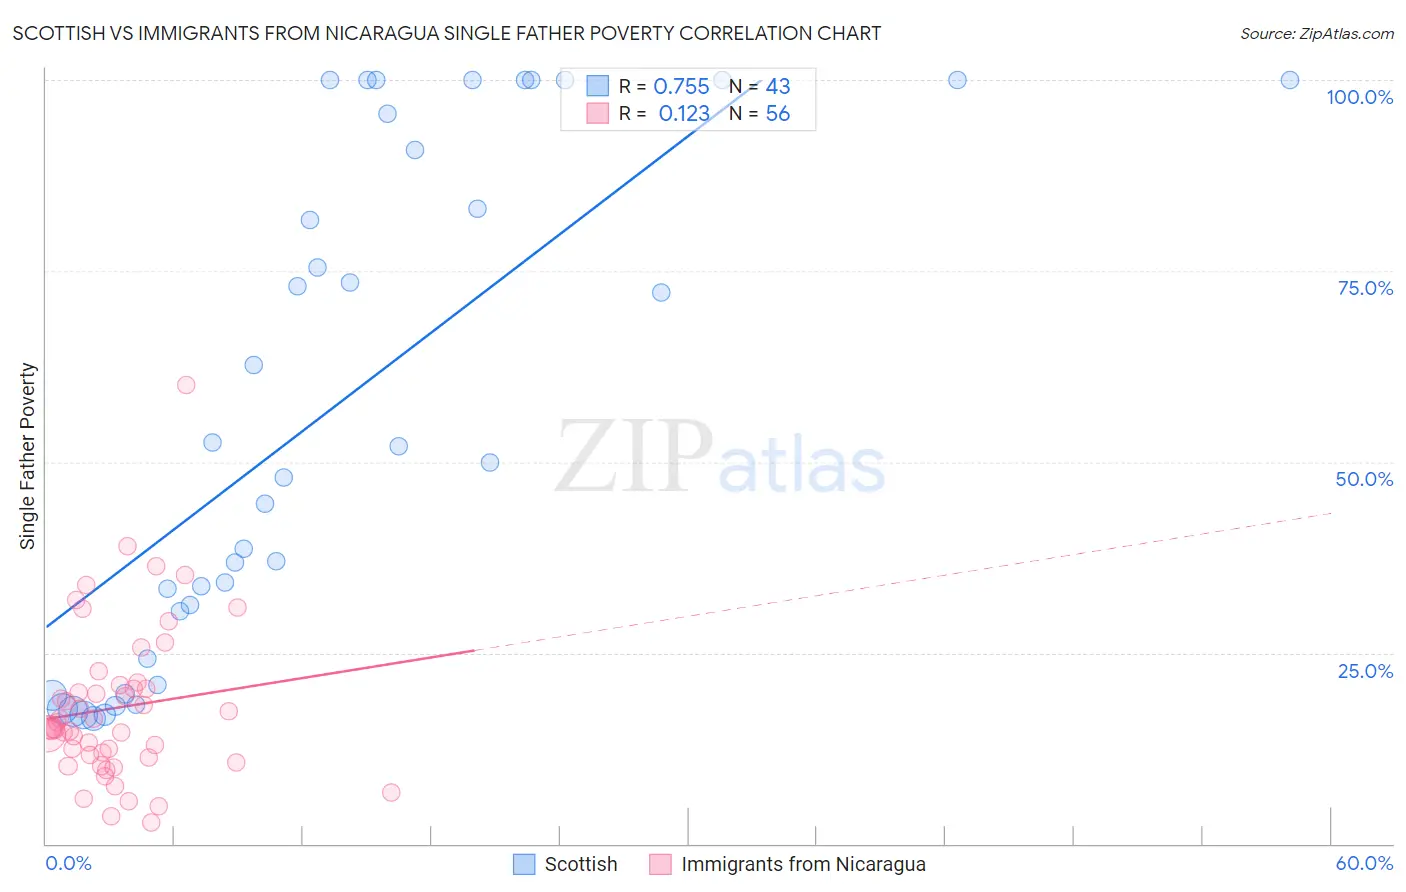
Scottish vs Immigrants from Nicaragua Single Father Poverty Correlation Chart
The statistical analysis conducted on geographies consisting of 405,098,352 people shows a strong positive correlation between the proportion of Scottish and poverty level among single fathers in the United States with a correlation coefficient (R) of 0.755 and weighted average of 17.7%. Similarly, the statistical analysis conducted on geographies consisting of 204,495,523 people shows a poor positive correlation between the proportion of Immigrants from Nicaragua and poverty level among single fathers in the United States with a correlation coefficient (R) of 0.123 and weighted average of 16.2%, a difference of 9.8%.
Single Father Poverty Correlation Summary
| Measurement | Scottish | Immigrants from Nicaragua |
| Minimum | 16.4% | 2.8% |
| Maximum | 100.0% | 60.0% |
| Range | 83.6% | 57.2% |
| Mean | 56.6% | 17.8% |
| Median | 50.0% | 15.2% |
| Interquartile 25% (IQ1) | 24.3% | 11.5% |
| Interquartile 75% (IQ3) | 95.6% | 20.6% |
| Interquartile Range (IQR) | 71.3% | 9.1% |
| Standard Deviation (Sample) | 32.4% | 10.3% |
| Standard Deviation (Population) | 32.1% | 10.2% |
Similar Demographics by Single Father Poverty
Demographics Similar to Scottish by Single Father Poverty
In terms of single father poverty, the demographic groups most similar to Scottish are Iroquois (17.7%, a difference of 0.050%), German (17.7%, a difference of 0.19%), Lebanese (17.7%, a difference of 0.20%), English (17.8%, a difference of 0.32%), and Dutch (17.8%, a difference of 0.32%).
| Demographics | Rating | Rank | Single Father Poverty |
| Italians | 0.1 /100 | #273 | Tragic 17.5% |
| Macedonians | 0.1 /100 | #274 | Tragic 17.7% |
| British West Indians | 0.0 /100 | #275 | Tragic 17.7% |
| German Russians | 0.0 /100 | #276 | Tragic 17.7% |
| Lebanese | 0.0 /100 | #277 | Tragic 17.7% |
| Germans | 0.0 /100 | #278 | Tragic 17.7% |
| Iroquois | 0.0 /100 | #279 | Tragic 17.7% |
| Scottish | 0.0 /100 | #280 | Tragic 17.7% |
| English | 0.0 /100 | #281 | Tragic 17.8% |
| Dutch | 0.0 /100 | #282 | Tragic 17.8% |
| Alsatians | 0.0 /100 | #283 | Tragic 17.8% |
| Welsh | 0.0 /100 | #284 | Tragic 17.8% |
| Immigrants | Lebanon | 0.0 /100 | #285 | Tragic 17.9% |
| Immigrants | North Macedonia | 0.0 /100 | #286 | Tragic 17.9% |
| Carpatho Rusyns | 0.0 /100 | #287 | Tragic 18.0% |
Demographics Similar to Immigrants from Nicaragua by Single Father Poverty
In terms of single father poverty, the demographic groups most similar to Immigrants from Nicaragua are Immigrants from Jordan (16.2%, a difference of 0.090%), Mexican (16.1%, a difference of 0.12%), Immigrants from Zimbabwe (16.1%, a difference of 0.22%), Immigrants from Israel (16.1%, a difference of 0.22%), and Immigrants from Czechoslovakia (16.2%, a difference of 0.25%).
| Demographics | Rating | Rank | Single Father Poverty |
| Nigerians | 76.8 /100 | #148 | Good 16.1% |
| South Africans | 75.1 /100 | #149 | Good 16.1% |
| Jordanians | 74.2 /100 | #150 | Good 16.1% |
| Immigrants | France | 73.1 /100 | #151 | Good 16.1% |
| Immigrants | Zimbabwe | 72.1 /100 | #152 | Good 16.1% |
| Immigrants | Israel | 72.0 /100 | #153 | Good 16.1% |
| Mexicans | 70.1 /100 | #154 | Good 16.1% |
| Immigrants | Nicaragua | 67.8 /100 | #155 | Good 16.2% |
| Immigrants | Jordan | 66.0 /100 | #156 | Good 16.2% |
| Immigrants | Czechoslovakia | 62.8 /100 | #157 | Good 16.2% |
| Portuguese | 62.3 /100 | #158 | Good 16.2% |
| Belizeans | 59.9 /100 | #159 | Average 16.2% |
| Immigrants | Sudan | 59.8 /100 | #160 | Average 16.2% |
| Estonians | 56.7 /100 | #161 | Average 16.2% |
| Ugandans | 55.9 /100 | #162 | Average 16.3% |