Celtic vs Menominee Single Father Poverty
COMPARE
Celtic
Menominee
Single Father Poverty
Single Father Poverty Comparison
Celtics
Menominee
18.5%
SINGLE FATHER POVERTY
0.0/ 100
METRIC RATING
303rd/ 347
METRIC RANK
16.8%
SINGLE FATHER POVERTY
6.4/ 100
METRIC RATING
225th/ 347
METRIC RANK
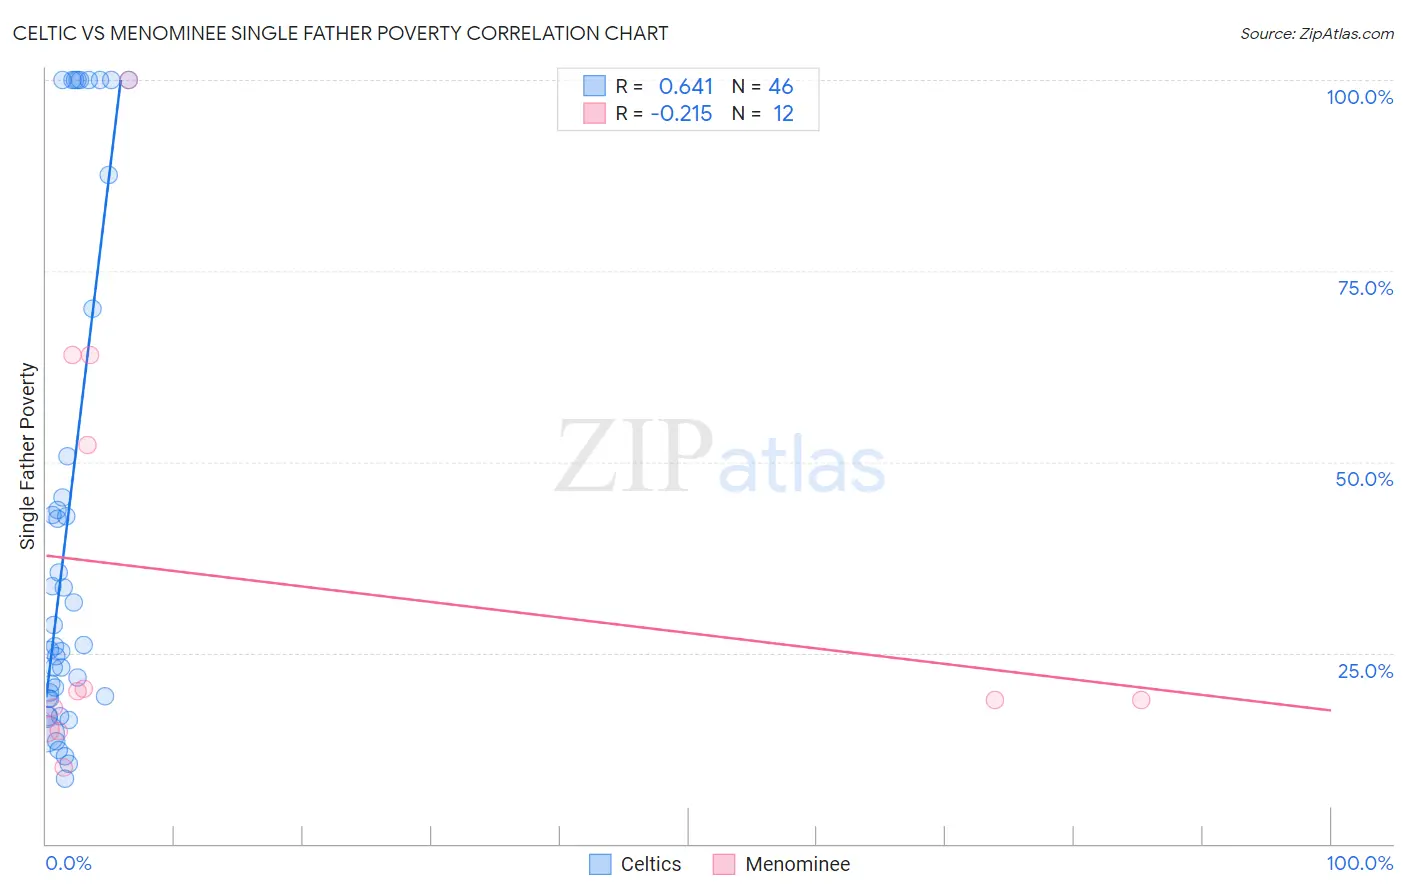
Celtic vs Menominee Single Father Poverty Correlation Chart
The statistical analysis conducted on geographies consisting of 145,202,349 people shows a significant positive correlation between the proportion of Celtics and poverty level among single fathers in the United States with a correlation coefficient (R) of 0.641 and weighted average of 18.5%. Similarly, the statistical analysis conducted on geographies consisting of 42,801,282 people shows a weak negative correlation between the proportion of Menominee and poverty level among single fathers in the United States with a correlation coefficient (R) of -0.215 and weighted average of 16.8%, a difference of 10.2%.
Single Father Poverty Correlation Summary
| Measurement | Celtic | Menominee |
| Minimum | 8.4% | 9.9% |
| Maximum | 100.0% | 100.0% |
| Range | 91.6% | 90.1% |
| Mean | 42.2% | 34.6% |
| Median | 26.0% | 19.4% |
| Interquartile 25% (IQ1) | 19.0% | 16.4% |
| Interquartile 75% (IQ3) | 50.8% | 58.1% |
| Interquartile Range (IQR) | 31.8% | 41.7% |
| Standard Deviation (Sample) | 32.4% | 28.5% |
| Standard Deviation (Population) | 32.1% | 27.2% |
Similar Demographics by Single Father Poverty
Demographics Similar to Celtics by Single Father Poverty
In terms of single father poverty, the demographic groups most similar to Celtics are Comanche (18.5%, a difference of 0.040%), Ute (18.5%, a difference of 0.14%), Hungarian (18.5%, a difference of 0.15%), Blackfeet (18.5%, a difference of 0.19%), and Immigrants from Dominican Republic (18.4%, a difference of 0.37%).
| Demographics | Rating | Rank | Single Father Poverty |
| Seminole | 0.0 /100 | #296 | Tragic 18.1% |
| French | 0.0 /100 | #297 | Tragic 18.2% |
| Africans | 0.0 /100 | #298 | Tragic 18.3% |
| Whites/Caucasians | 0.0 /100 | #299 | Tragic 18.4% |
| Immigrants | Dominican Republic | 0.0 /100 | #300 | Tragic 18.4% |
| Hungarians | 0.0 /100 | #301 | Tragic 18.5% |
| Comanche | 0.0 /100 | #302 | Tragic 18.5% |
| Celtics | 0.0 /100 | #303 | Tragic 18.5% |
| Ute | 0.0 /100 | #304 | Tragic 18.5% |
| Blackfeet | 0.0 /100 | #305 | Tragic 18.5% |
| Scotch-Irish | 0.0 /100 | #306 | Tragic 18.6% |
| French Canadians | 0.0 /100 | #307 | Tragic 18.6% |
| Ottawa | 0.0 /100 | #308 | Tragic 18.6% |
| Immigrants | Micronesia | 0.0 /100 | #309 | Tragic 18.6% |
| Chippewa | 0.0 /100 | #310 | Tragic 18.8% |
Demographics Similar to Menominee by Single Father Poverty
In terms of single father poverty, the demographic groups most similar to Menominee are Immigrants from Norway (16.8%, a difference of 0.020%), Hispanic or Latino (16.8%, a difference of 0.050%), Immigrants from Austria (16.8%, a difference of 0.10%), British (16.8%, a difference of 0.15%), and Belgian (16.8%, a difference of 0.21%).
| Demographics | Rating | Rank | Single Father Poverty |
| Immigrants | Uganda | 8.6 /100 | #218 | Tragic 16.7% |
| Immigrants | Ghana | 8.1 /100 | #219 | Tragic 16.7% |
| Immigrants | Denmark | 8.1 /100 | #220 | Tragic 16.7% |
| Immigrants | Greece | 8.1 /100 | #221 | Tragic 16.7% |
| Immigrants | Spain | 8.0 /100 | #222 | Tragic 16.7% |
| Immigrants | Austria | 7.0 /100 | #223 | Tragic 16.8% |
| Immigrants | Norway | 6.5 /100 | #224 | Tragic 16.8% |
| Menominee | 6.4 /100 | #225 | Tragic 16.8% |
| Hispanics or Latinos | 6.1 /100 | #226 | Tragic 16.8% |
| British | 5.6 /100 | #227 | Tragic 16.8% |
| Belgians | 5.3 /100 | #228 | Tragic 16.8% |
| Israelis | 4.6 /100 | #229 | Tragic 16.8% |
| Immigrants | Trinidad and Tobago | 4.5 /100 | #230 | Tragic 16.8% |
| Spanish Americans | 3.7 /100 | #231 | Tragic 16.9% |
| Immigrants | Grenada | 3.7 /100 | #232 | Tragic 16.9% |