Barbadian vs Immigrants from Netherlands Male Poverty
COMPARE
Barbadian
Immigrants from Netherlands
Male Poverty
Male Poverty Comparison
Barbadians
Immigrants from Netherlands
13.6%
MALE POVERTY
0.0/ 100
METRIC RATING
275th/ 347
METRIC RANK
10.2%
MALE POVERTY
97.3/ 100
METRIC RATING
67th/ 347
METRIC RANK
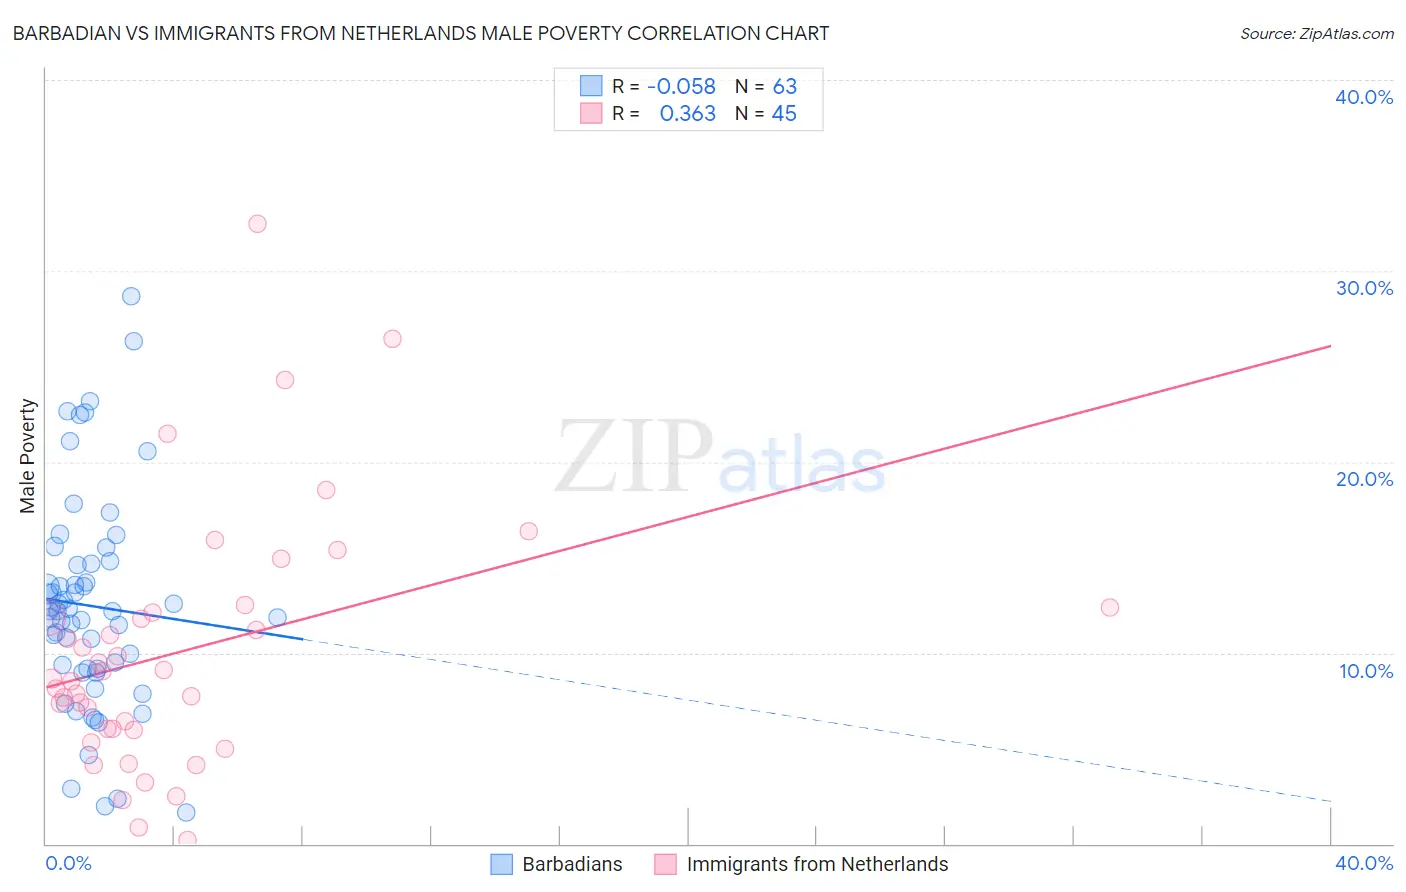
Barbadian vs Immigrants from Netherlands Male Poverty Correlation Chart
The statistical analysis conducted on geographies consisting of 141,266,401 people shows a slight negative correlation between the proportion of Barbadians and poverty level among males in the United States with a correlation coefficient (R) of -0.058 and weighted average of 13.6%. Similarly, the statistical analysis conducted on geographies consisting of 237,754,800 people shows a mild positive correlation between the proportion of Immigrants from Netherlands and poverty level among males in the United States with a correlation coefficient (R) of 0.363 and weighted average of 10.2%, a difference of 33.1%.
Male Poverty Correlation Summary
| Measurement | Barbadian | Immigrants from Netherlands |
| Minimum | 1.6% | 0.21% |
| Maximum | 28.7% | 32.5% |
| Range | 27.1% | 32.3% |
| Mean | 12.5% | 10.1% |
| Median | 12.2% | 8.7% |
| Interquartile 25% (IQ1) | 9.2% | 6.0% |
| Interquartile 75% (IQ3) | 14.7% | 12.3% |
| Interquartile Range (IQR) | 5.5% | 6.3% |
| Standard Deviation (Sample) | 5.6% | 6.6% |
| Standard Deviation (Population) | 5.5% | 6.6% |
Similar Demographics by Male Poverty
Demographics Similar to Barbadians by Male Poverty
In terms of male poverty, the demographic groups most similar to Barbadians are Immigrants from Latin America (13.6%, a difference of 0.19%), Bangladeshi (13.6%, a difference of 0.34%), Belizean (13.6%, a difference of 0.44%), Haitian (13.7%, a difference of 0.61%), and Immigrants from West Indies (13.5%, a difference of 0.62%).
| Demographics | Rating | Rank | Male Poverty |
| Sub-Saharan Africans | 0.1 /100 | #268 | Tragic 13.3% |
| Guyanese | 0.0 /100 | #269 | Tragic 13.3% |
| Cree | 0.0 /100 | #270 | Tragic 13.3% |
| Spanish Americans | 0.0 /100 | #271 | Tragic 13.4% |
| Immigrants | Bahamas | 0.0 /100 | #272 | Tragic 13.5% |
| Chickasaw | 0.0 /100 | #273 | Tragic 13.5% |
| Immigrants | West Indies | 0.0 /100 | #274 | Tragic 13.5% |
| Barbadians | 0.0 /100 | #275 | Tragic 13.6% |
| Immigrants | Latin America | 0.0 /100 | #276 | Tragic 13.6% |
| Bangladeshis | 0.0 /100 | #277 | Tragic 13.6% |
| Belizeans | 0.0 /100 | #278 | Tragic 13.6% |
| Haitians | 0.0 /100 | #279 | Tragic 13.7% |
| Mexicans | 0.0 /100 | #280 | Tragic 13.7% |
| Yaqui | 0.0 /100 | #281 | Tragic 13.7% |
| Immigrants | Cabo Verde | 0.0 /100 | #282 | Tragic 13.7% |
Demographics Similar to Immigrants from Netherlands by Male Poverty
In terms of male poverty, the demographic groups most similar to Immigrants from Netherlands are Immigrants from Sri Lanka (10.2%, a difference of 0.050%), Serbian (10.2%, a difference of 0.17%), Zimbabwean (10.2%, a difference of 0.18%), Immigrants from Australia (10.2%, a difference of 0.18%), and Paraguayan (10.2%, a difference of 0.20%).
| Demographics | Rating | Rank | Male Poverty |
| Ukrainians | 97.9 /100 | #60 | Exceptional 10.1% |
| Austrians | 97.8 /100 | #61 | Exceptional 10.1% |
| Immigrants | Italy | 97.8 /100 | #62 | Exceptional 10.2% |
| Slovaks | 97.7 /100 | #63 | Exceptional 10.2% |
| Swiss | 97.5 /100 | #64 | Exceptional 10.2% |
| Zimbabweans | 97.5 /100 | #65 | Exceptional 10.2% |
| Serbians | 97.5 /100 | #66 | Exceptional 10.2% |
| Immigrants | Netherlands | 97.3 /100 | #67 | Exceptional 10.2% |
| Immigrants | Sri Lanka | 97.2 /100 | #68 | Exceptional 10.2% |
| Immigrants | Australia | 97.1 /100 | #69 | Exceptional 10.2% |
| Paraguayans | 97.1 /100 | #70 | Exceptional 10.2% |
| Europeans | 97.1 /100 | #71 | Exceptional 10.2% |
| Immigrants | Canada | 97.1 /100 | #72 | Exceptional 10.2% |
| Immigrants | Asia | 97.0 /100 | #73 | Exceptional 10.2% |
| Immigrants | Eastern Europe | 96.9 /100 | #74 | Exceptional 10.2% |