Bahamian vs Immigrants from Netherlands Male Poverty
COMPARE
Bahamian
Immigrants from Netherlands
Male Poverty
Male Poverty Comparison
Bahamians
Immigrants from Netherlands
14.1%
MALE POVERTY
0.0/ 100
METRIC RATING
303rd/ 347
METRIC RANK
10.2%
MALE POVERTY
97.3/ 100
METRIC RATING
67th/ 347
METRIC RANK
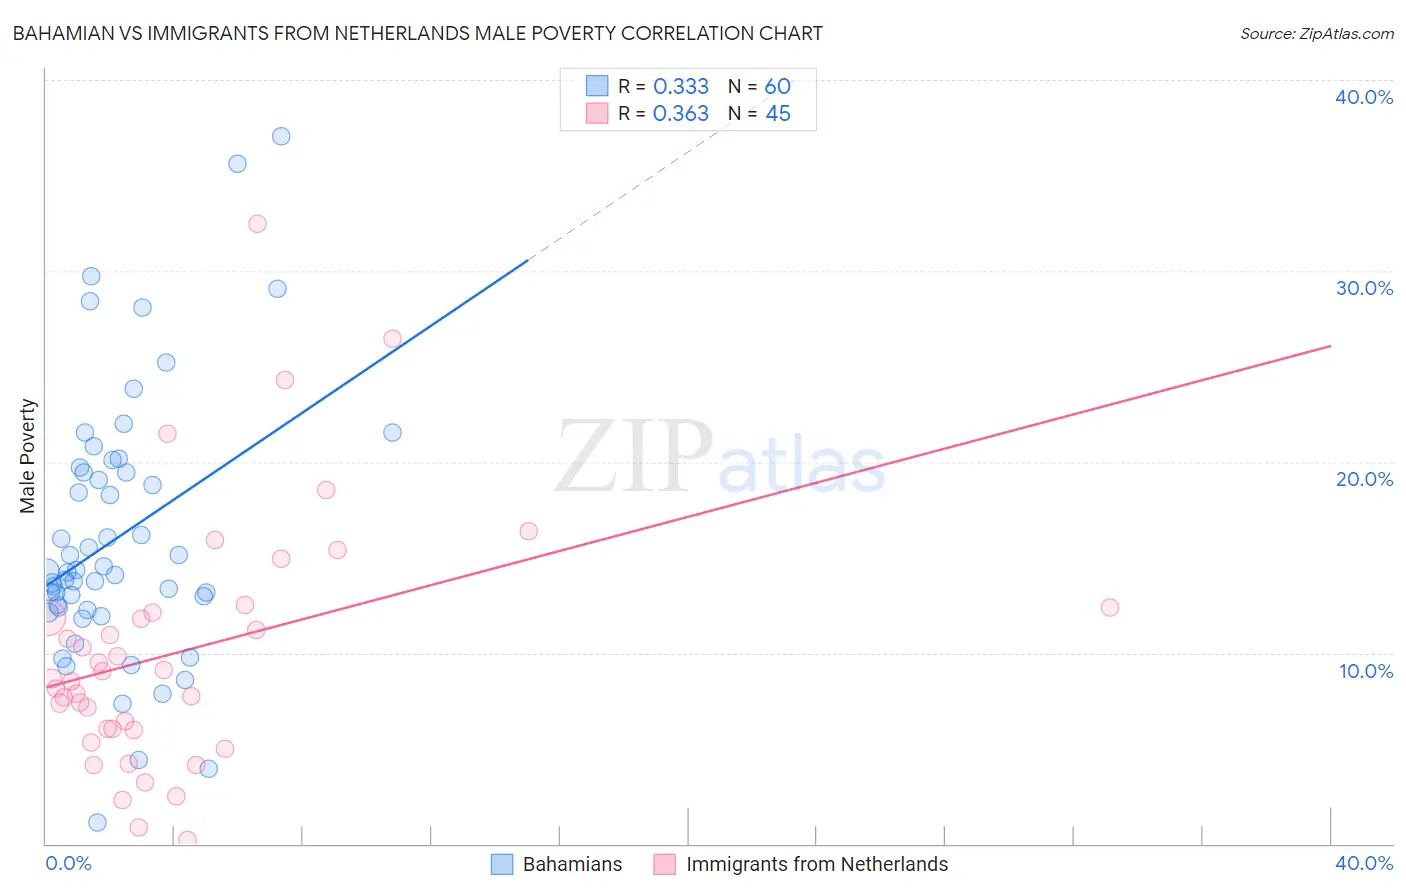
Bahamian vs Immigrants from Netherlands Male Poverty Correlation Chart
The statistical analysis conducted on geographies consisting of 112,626,809 people shows a mild positive correlation between the proportion of Bahamians and poverty level among males in the United States with a correlation coefficient (R) of 0.333 and weighted average of 14.1%. Similarly, the statistical analysis conducted on geographies consisting of 237,754,800 people shows a mild positive correlation between the proportion of Immigrants from Netherlands and poverty level among males in the United States with a correlation coefficient (R) of 0.363 and weighted average of 10.2%, a difference of 37.7%.
Male Poverty Correlation Summary
| Measurement | Bahamian | Immigrants from Netherlands |
| Minimum | 1.1% | 0.21% |
| Maximum | 37.0% | 32.5% |
| Range | 35.9% | 32.3% |
| Mean | 16.1% | 10.1% |
| Median | 14.3% | 8.7% |
| Interquartile 25% (IQ1) | 12.3% | 6.0% |
| Interquartile 75% (IQ3) | 19.6% | 12.3% |
| Interquartile Range (IQR) | 7.3% | 6.3% |
| Standard Deviation (Sample) | 7.1% | 6.6% |
| Standard Deviation (Population) | 7.0% | 6.6% |
Similar Demographics by Male Poverty
Demographics Similar to Bahamians by Male Poverty
In terms of male poverty, the demographic groups most similar to Bahamians are Immigrants from Caribbean (14.0%, a difference of 0.040%), Immigrants from Senegal (14.0%, a difference of 0.10%), Senegalese (14.1%, a difference of 0.10%), Immigrants from Mexico (14.0%, a difference of 0.17%), and Immigrants from Guatemala (14.0%, a difference of 0.28%).
| Demographics | Rating | Rank | Male Poverty |
| Cajuns | 0.0 /100 | #296 | Tragic 13.9% |
| Inupiat | 0.0 /100 | #297 | Tragic 14.0% |
| Blackfeet | 0.0 /100 | #298 | Tragic 14.0% |
| Immigrants | Guatemala | 0.0 /100 | #299 | Tragic 14.0% |
| Immigrants | Mexico | 0.0 /100 | #300 | Tragic 14.0% |
| Immigrants | Senegal | 0.0 /100 | #301 | Tragic 14.0% |
| Immigrants | Caribbean | 0.0 /100 | #302 | Tragic 14.0% |
| Bahamians | 0.0 /100 | #303 | Tragic 14.1% |
| Senegalese | 0.0 /100 | #304 | Tragic 14.1% |
| Immigrants | Bangladesh | 0.0 /100 | #305 | Tragic 14.1% |
| Creek | 0.0 /100 | #306 | Tragic 14.1% |
| Dutch West Indians | 0.0 /100 | #307 | Tragic 14.2% |
| Africans | 0.0 /100 | #308 | Tragic 14.2% |
| Somalis | 0.0 /100 | #309 | Tragic 14.3% |
| Seminole | 0.0 /100 | #310 | Tragic 14.3% |
Demographics Similar to Immigrants from Netherlands by Male Poverty
In terms of male poverty, the demographic groups most similar to Immigrants from Netherlands are Immigrants from Sri Lanka (10.2%, a difference of 0.050%), Serbian (10.2%, a difference of 0.17%), Zimbabwean (10.2%, a difference of 0.18%), Immigrants from Australia (10.2%, a difference of 0.18%), and Paraguayan (10.2%, a difference of 0.20%).
| Demographics | Rating | Rank | Male Poverty |
| Ukrainians | 97.9 /100 | #60 | Exceptional 10.1% |
| Austrians | 97.8 /100 | #61 | Exceptional 10.1% |
| Immigrants | Italy | 97.8 /100 | #62 | Exceptional 10.2% |
| Slovaks | 97.7 /100 | #63 | Exceptional 10.2% |
| Swiss | 97.5 /100 | #64 | Exceptional 10.2% |
| Zimbabweans | 97.5 /100 | #65 | Exceptional 10.2% |
| Serbians | 97.5 /100 | #66 | Exceptional 10.2% |
| Immigrants | Netherlands | 97.3 /100 | #67 | Exceptional 10.2% |
| Immigrants | Sri Lanka | 97.2 /100 | #68 | Exceptional 10.2% |
| Immigrants | Australia | 97.1 /100 | #69 | Exceptional 10.2% |
| Paraguayans | 97.1 /100 | #70 | Exceptional 10.2% |
| Europeans | 97.1 /100 | #71 | Exceptional 10.2% |
| Immigrants | Canada | 97.1 /100 | #72 | Exceptional 10.2% |
| Immigrants | Asia | 97.0 /100 | #73 | Exceptional 10.2% |
| Immigrants | Eastern Europe | 96.9 /100 | #74 | Exceptional 10.2% |