Immigrants from Indonesia vs Immigrants from Netherlands Male Poverty

COMPARE

Immigrants from Indonesia
Race
Ancestry
AfghanAfricanAlaska NativeAlaskan AthabascanAlbanianAleutAlsatianAmericanApacheArabArapahoArgentineanArmenianAssyrian/Chaldean/SyriacAustralianAustrianBahamianBangladeshiBarbadianBasqueBelgianBelizeanBermudanBhutaneseBlackfeetBolivianBrazilianBritishBritish West IndianBulgarianBurmeseCajunCambodianCanadianCape VerdeanCarpatho RusynCelticCentral AmericanCentral American IndianCherokeeCheyenneChickasawChileanChineseChippewaChoctawColombianColvilleComancheCosta RicanCreeCreekCroatianCrowCubanCypriotCzechCzechoslovakianDanishDelawareDominicanDutchDutch West IndianEastern EuropeanEcuadorianEgyptianEnglishEstonianEthiopianEuropeanFijianFilipinoFinnishFrenchFrench American IndianFrench CanadianGermanGerman RussianGhanaianGreekGuamanian/ChamorroGuatemalanGuyaneseHaitianHmongHonduranHopiHoumaHungarianIcelanderIndian (Asian)IndonesianInupiatIranianIraqiIrishIroquoisIsraeliItalianJamaicanJapaneseJordanianKenyanKiowaKoreanLaotianLatvianLebaneseLiberianLithuanianLumbeeLuxembourgerMacedonianMalaysianMalteseMarshalleseMenomineeMexicanMexican American IndianMongolianMoroccanNative HawaiianNavajoNepaleseNew ZealanderNicaraguanNigerianNorthern EuropeanNorwegianOkinawanOsageOttawaPaiutePakistaniPalestinianPanamanianParaguayanPennsylvania GermanPeruvianPimaPolishPortuguesePotawatomiPuebloPuerto RicanPuget Sound SalishRomanianRussianSalvadoranSamoanScandinavianScotch-IrishScottishSeminoleSenegaleseSerbianShoshoneSierra LeoneanSiouxSlavicSlovakSloveneSomaliSouth AfricanSouth AmericanSouth American IndianSoviet UnionSpaniardSpanishSpanish AmericanSpanish American IndianSri LankanSubsaharan AfricanSudaneseSwedishSwissSyrianTaiwaneseThaiTlingit-HaidaTohono O'OdhamTonganTrinidadian and TobagonianTsimshianTurkishU.S. Virgin IslanderUgandanUkrainianUruguayanUteVenezuelanVietnameseWelshWest IndianYakamaYaquiYugoslavianYumanYup'ikZimbabwean
Immigration
NonimmigrantsImmigrantsAfghanistanAfricaAlbaniaArgentinaArmeniaAsiaAustraliaAustriaBahamasBangladeshBarbadosBelarusBelgiumBelizeBoliviaBosnia and HerzegovinaBrazilBulgariaBurma/MyanmarCabo VerdeCambodiaCameroonCanadaCaribbeanCentral AmericaChileChinaColombiaCongoCosta RicaCroatiaCubaCzechoslovakiaDenmarkDominicaDominican RepublicEastern AfricaEastern AsiaEastern EuropeEcuadorEgyptEl SalvadorEnglandEritreaEthiopiaEuropeFijiFranceGermanyGhanaGreeceGrenadaGuatemalaGuyanaHaitiHondurasHong KongHungaryIndiaIndonesiaIranIraqIrelandIsraelItalyJamaicaJapanJordanKazakhstanKenyaKoreaKuwaitLaosLatin AmericaLatviaLebanonLiberiaLithuaniaMalaysiaMexicoMicronesiaMiddle AfricaMoldovaMoroccoNepalNicaraguaNigeriaNorth AmericaNorth MacedoniaNorthern AfricaNorthern EuropeNorwayOceaniaPakistanPanamaPeruPhilippinesPolandPortugalRomaniaRussiaSaudi ArabiaScotlandSenegalSerbiaSierra LeoneSingaporeSomaliaSouth AfricaSouth AmericaSouth Central AsiaSouth Eastern AsiaSouthern EuropeSpainSri LankaSt. Vincent and the GrenadinesSudanSwedenSwitzerlandSyriaTaiwanThailandTrinidad and TobagoTurkeyUgandaUkraineUruguayUzbekistanVenezuelaVietnamWest IndiesWestern AfricaWestern AsiaWestern EuropeYemenZaireZimbabweAzores
Immigrants from Netherlands
Race
Ancestry
AfghanAfricanAlaska NativeAlaskan AthabascanAlbanianAleutAlsatianAmericanApacheArabArapahoArgentineanArmenianAssyrian/Chaldean/SyriacAustralianAustrianBahamianBangladeshiBarbadianBasqueBelgianBelizeanBermudanBhutaneseBlackfeetBolivianBrazilianBritishBritish West IndianBulgarianBurmeseCajunCambodianCanadianCape VerdeanCarpatho RusynCelticCentral AmericanCentral American IndianCherokeeCheyenneChickasawChileanChineseChippewaChoctawColombianColvilleComancheCosta RicanCreeCreekCroatianCrowCubanCypriotCzechCzechoslovakianDanishDelawareDominicanDutchDutch West IndianEastern EuropeanEcuadorianEgyptianEnglishEstonianEthiopianEuropeanFijianFilipinoFinnishFrenchFrench American IndianFrench CanadianGermanGerman RussianGhanaianGreekGuamanian/ChamorroGuatemalanGuyaneseHaitianHmongHonduranHopiHoumaHungarianIcelanderIndian (Asian)IndonesianInupiatIranianIraqiIrishIroquoisIsraeliItalianJamaicanJapaneseJordanianKenyanKiowaKoreanLaotianLatvianLebaneseLiberianLithuanianLumbeeLuxembourgerMacedonianMalaysianMalteseMarshalleseMenomineeMexicanMexican American IndianMongolianMoroccanNative HawaiianNavajoNepaleseNew ZealanderNicaraguanNigerianNorthern EuropeanNorwegianOkinawanOsageOttawaPaiutePakistaniPalestinianPanamanianParaguayanPennsylvania GermanPeruvianPimaPolishPortuguesePotawatomiPuebloPuerto RicanPuget Sound SalishRomanianRussianSalvadoranSamoanScandinavianScotch-IrishScottishSeminoleSenegaleseSerbianShoshoneSierra LeoneanSiouxSlavicSlovakSloveneSomaliSouth AfricanSouth AmericanSouth American IndianSoviet UnionSpaniardSpanishSpanish AmericanSpanish American IndianSri LankanSubsaharan AfricanSudaneseSwedishSwissSyrianTaiwaneseThaiTlingit-HaidaTohono O'OdhamTonganTrinidadian and TobagonianTsimshianTurkishU.S. Virgin IslanderUgandanUkrainianUruguayanUteVenezuelanVietnameseWelshWest IndianYakamaYaquiYugoslavianYumanYup'ikZimbabwean
Immigration
NonimmigrantsImmigrantsAfghanistanAfricaAlbaniaArgentinaArmeniaAsiaAustraliaAustriaBahamasBangladeshBarbadosBelarusBelgiumBelizeBoliviaBosnia and HerzegovinaBrazilBulgariaBurma/MyanmarCabo VerdeCambodiaCameroonCanadaCaribbeanCentral AmericaChileChinaColombiaCongoCosta RicaCroatiaCubaCzechoslovakiaDenmarkDominicaDominican RepublicEastern AfricaEastern AsiaEastern EuropeEcuadorEgyptEl SalvadorEnglandEritreaEthiopiaEuropeFijiFranceGermanyGhanaGreeceGrenadaGuatemalaGuyanaHaitiHondurasHong KongHungaryIndiaIranIraqIrelandIsraelItalyJamaicaJapanJordanKazakhstanKenyaKoreaKuwaitLaosLatin AmericaLatviaLebanonLiberiaLithuaniaMalaysiaMexicoMicronesiaMiddle AfricaMoldovaMoroccoNepalNetherlandsNicaraguaNigeriaNorth AmericaNorth MacedoniaNorthern AfricaNorthern EuropeNorwayOceaniaPakistanPanamaPeruPhilippinesPolandPortugalRomaniaRussiaSaudi ArabiaScotlandSenegalSerbiaSierra LeoneSingaporeSomaliaSouth AfricaSouth AmericaSouth Central AsiaSouth Eastern AsiaSouthern EuropeSpainSri LankaSt. Vincent and the GrenadinesSudanSwedenSwitzerlandSyriaTaiwanThailandTrinidad and TobagoTurkeyUgandaUkraineUruguayUzbekistanVenezuelaVietnamWest IndiesWestern AfricaWestern AsiaWestern EuropeYemenZaireZimbabweAzores
Male Poverty
Income
Poverty
Unemployment
Labor Participation
Family Structure
Vehicle Availability
Education Level
Disability

Male Poverty Comparison

Immigrants from Indonesia

Immigrants from Netherlands

Exceptional
Exceptional
10.5%
MALE POVERTY
93.3/ 100
METRIC RATING
99th/ 347
METRIC RANK
10.2%
MALE POVERTY
97.3/ 100
METRIC RATING
67th/ 347
METRIC RANK

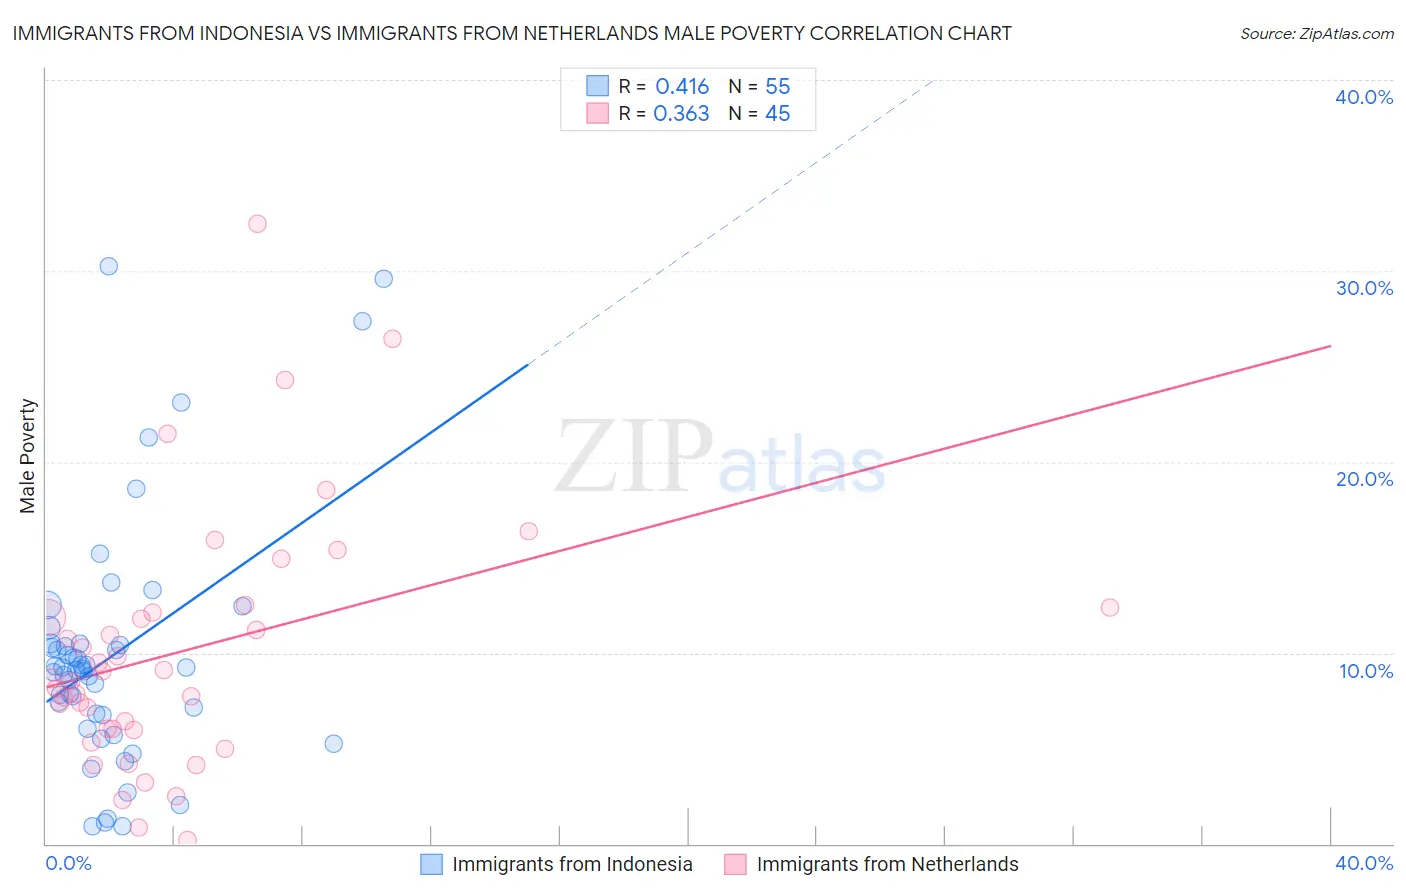
Immigrants from Indonesia vs Immigrants from Netherlands Male Poverty Correlation Chart

The statistical analysis conducted on geographies consisting of 215,697,022 people shows a moderate positive correlation between the proportion of Immigrants from Indonesia and poverty level among males in the United States with a correlation coefficient (R) of 0.416 and weighted average of 10.5%. Similarly, the statistical analysis conducted on geographies consisting of 237,754,800 people shows a mild positive correlation between the proportion of Immigrants from Netherlands and poverty level among males in the United States with a correlation coefficient (R) of 0.363 and weighted average of 10.2%, a difference of 2.6%.
Immigrants from Indonesia vs Immigrants from Netherlands Male Poverty

Male Poverty Correlation Summary

MeasurementImmigrants from IndonesiaImmigrants from Netherlands
Minimum0.89%0.21%
Maximum30.3%32.5%
Range29.4%32.3%
Mean9.9%10.1%
Median9.2%8.7%
Interquartile 25% (IQ1)6.8%6.0%
Interquartile 75% (IQ3)10.5%12.3%
Interquartile Range (IQR)3.7%6.3%
Standard Deviation (Sample)6.4%6.6%
Standard Deviation (Population)6.3%6.6%

Similar Demographics by Male Poverty

Demographics Similar to Immigrants from Indonesia by Male Poverty

In terms of male poverty, the demographic groups most similar to Immigrants from Indonesia are Finnish (10.5%, a difference of 0.060%), Romanian (10.5%, a difference of 0.13%), Immigrants from Egypt (10.4%, a difference of 0.18%), Immigrants from Latvia (10.5%, a difference of 0.21%), and Scottish (10.4%, a difference of 0.31%).
DemographicsRating | RankMale Poverty
Jordanians
94.4
/100
|
#92
Exceptional
10.4%
Australians
94.4
/100
|
#93
Exceptional
10.4%
Immigrants | South Africa
94.1
/100
|
#94
Exceptional
10.4%
Scottish
94.0
/100
|
#95
Exceptional
10.4%
Immigrants | Egypt
93.7
/100
|
#96
Exceptional
10.4%
Romanians
93.6
/100
|
#97
Exceptional
10.5%
Finns
93.4
/100
|
#98
Exceptional
10.5%
Immigrants | Indonesia
93.3
/100
|
#99
Exceptional
10.5%
Immigrants | Latvia
92.8
/100
|
#100
Exceptional
10.5%
Immigrants | Zimbabwe
92.0
/100
|
#101
Exceptional
10.5%
French Canadians
91.9
/100
|
#102
Exceptional
10.5%
Slavs
91.7
/100
|
#103
Exceptional
10.5%
Welsh
91.6
/100
|
#104
Exceptional
10.5%
Canadians
91.6
/100
|
#105
Exceptional
10.5%
Immigrants | Southern Europe
91.3
/100
|
#106
Exceptional
10.5%

Demographics Similar to Immigrants from Netherlands by Male Poverty

In terms of male poverty, the demographic groups most similar to Immigrants from Netherlands are Immigrants from Sri Lanka (10.2%, a difference of 0.050%), Serbian (10.2%, a difference of 0.17%), Zimbabwean (10.2%, a difference of 0.18%), Immigrants from Australia (10.2%, a difference of 0.18%), and Paraguayan (10.2%, a difference of 0.20%).
DemographicsRating | RankMale Poverty
Ukrainians
97.9
/100
|
#60
Exceptional
10.1%
Austrians
97.8
/100
|
#61
Exceptional
10.1%
Immigrants | Italy
97.8
/100
|
#62
Exceptional
10.2%
Slovaks
97.7
/100
|
#63
Exceptional
10.2%
Swiss
97.5
/100
|
#64
Exceptional
10.2%
Zimbabweans
97.5
/100
|
#65
Exceptional
10.2%
Serbians
97.5
/100
|
#66
Exceptional
10.2%
Immigrants | Netherlands
97.3
/100
|
#67
Exceptional
10.2%
Immigrants | Sri Lanka
97.2
/100
|
#68
Exceptional
10.2%
Immigrants | Australia
97.1
/100
|
#69
Exceptional
10.2%
Paraguayans
97.1
/100
|
#70
Exceptional
10.2%
Europeans
97.1
/100
|
#71
Exceptional
10.2%
Immigrants | Canada
97.1
/100
|
#72
Exceptional
10.2%
Immigrants | Asia
97.0
/100
|
#73
Exceptional
10.2%
Immigrants | Eastern Europe
96.9
/100
|
#74
Exceptional
10.2%