Aleut vs Immigrants from Netherlands Male Poverty
COMPARE
Aleut
Immigrants from Netherlands
Male Poverty
Male Poverty Comparison
Aleuts
Immigrants from Netherlands
11.8%
MALE POVERTY
10.4/ 100
METRIC RATING
202nd/ 347
METRIC RANK
10.2%
MALE POVERTY
97.3/ 100
METRIC RATING
67th/ 347
METRIC RANK
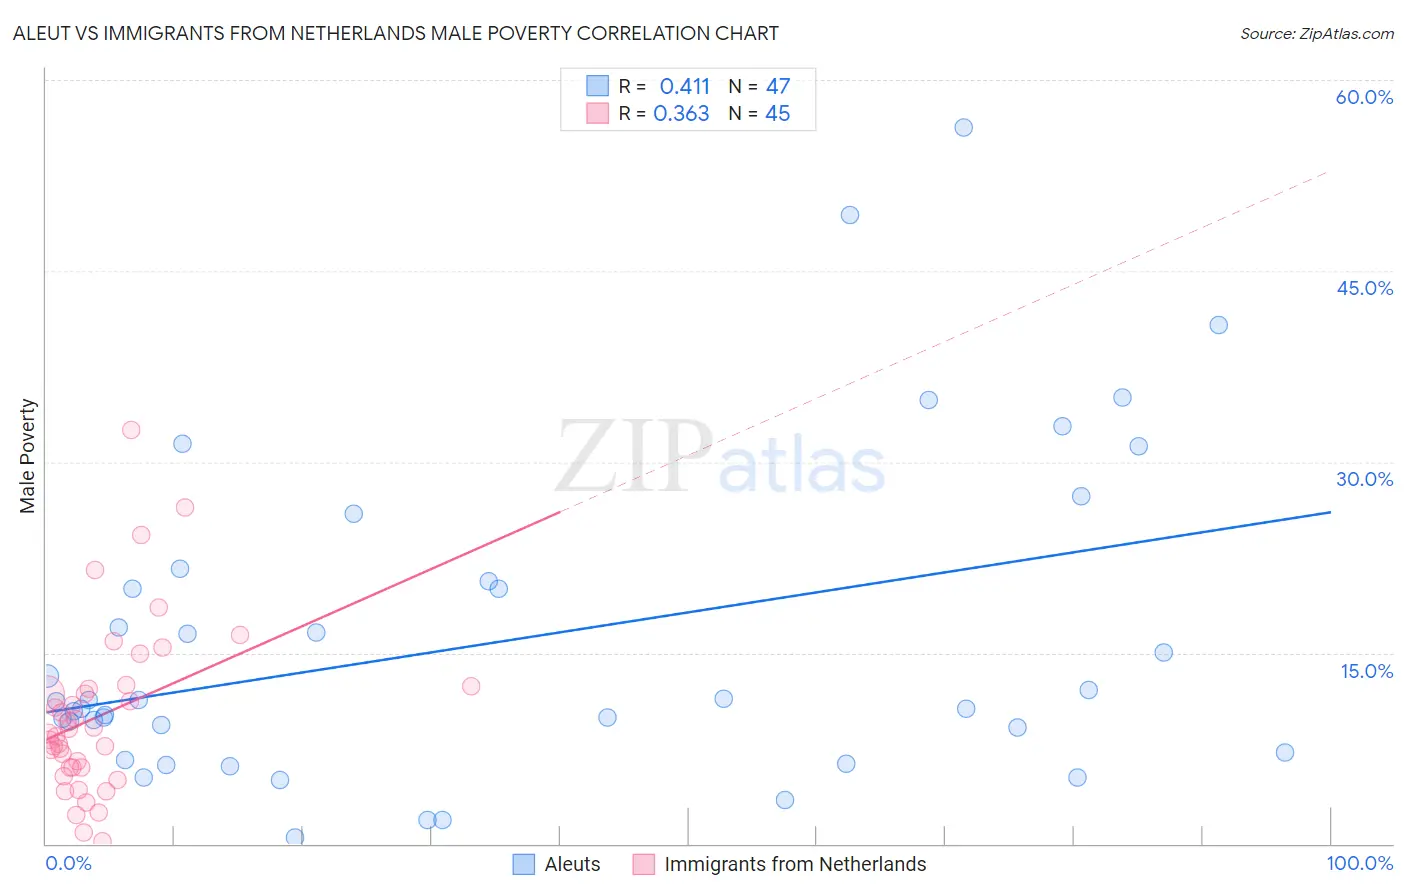
Aleut vs Immigrants from Netherlands Male Poverty Correlation Chart
The statistical analysis conducted on geographies consisting of 61,774,316 people shows a moderate positive correlation between the proportion of Aleuts and poverty level among males in the United States with a correlation coefficient (R) of 0.411 and weighted average of 11.8%. Similarly, the statistical analysis conducted on geographies consisting of 237,754,800 people shows a mild positive correlation between the proportion of Immigrants from Netherlands and poverty level among males in the United States with a correlation coefficient (R) of 0.363 and weighted average of 10.2%, a difference of 15.4%.
Male Poverty Correlation Summary
| Measurement | Aleut | Immigrants from Netherlands |
| Minimum | 0.53% | 0.21% |
| Maximum | 56.2% | 32.5% |
| Range | 55.7% | 32.3% |
| Mean | 15.9% | 10.1% |
| Median | 11.2% | 8.7% |
| Interquartile 25% (IQ1) | 7.1% | 6.0% |
| Interquartile 75% (IQ3) | 20.6% | 12.3% |
| Interquartile Range (IQR) | 13.5% | 6.3% |
| Standard Deviation (Sample) | 12.6% | 6.6% |
| Standard Deviation (Population) | 12.4% | 6.6% |
Similar Demographics by Male Poverty
Demographics Similar to Aleuts by Male Poverty
In terms of male poverty, the demographic groups most similar to Aleuts are Immigrants from Western Asia (11.8%, a difference of 0.14%), Immigrants from Uganda (11.8%, a difference of 0.50%), Spaniard (11.7%, a difference of 0.71%), Immigrants from Lebanon (11.7%, a difference of 0.72%), and Spanish (11.7%, a difference of 0.82%).
| Demographics | Rating | Rank | Male Poverty |
| Arabs | 15.8 /100 | #195 | Poor 11.6% |
| Hmong | 15.8 /100 | #196 | Poor 11.6% |
| Delaware | 15.4 /100 | #197 | Poor 11.7% |
| Iraqis | 14.7 /100 | #198 | Poor 11.7% |
| Spanish | 14.1 /100 | #199 | Poor 11.7% |
| Immigrants | Lebanon | 13.6 /100 | #200 | Poor 11.7% |
| Spaniards | 13.5 /100 | #201 | Poor 11.7% |
| Aleuts | 10.4 /100 | #202 | Poor 11.8% |
| Immigrants | Western Asia | 9.8 /100 | #203 | Tragic 11.8% |
| Immigrants | Uganda | 8.5 /100 | #204 | Tragic 11.8% |
| Panamanians | 6.2 /100 | #205 | Tragic 11.9% |
| Immigrants | Eastern Africa | 5.4 /100 | #206 | Tragic 12.0% |
| Malaysians | 5.2 /100 | #207 | Tragic 12.0% |
| Immigrants | Immigrants | 4.5 /100 | #208 | Tragic 12.0% |
| Immigrants | Azores | 4.3 /100 | #209 | Tragic 12.0% |
Demographics Similar to Immigrants from Netherlands by Male Poverty
In terms of male poverty, the demographic groups most similar to Immigrants from Netherlands are Immigrants from Sri Lanka (10.2%, a difference of 0.050%), Serbian (10.2%, a difference of 0.17%), Zimbabwean (10.2%, a difference of 0.18%), Immigrants from Australia (10.2%, a difference of 0.18%), and Paraguayan (10.2%, a difference of 0.20%).
| Demographics | Rating | Rank | Male Poverty |
| Ukrainians | 97.9 /100 | #60 | Exceptional 10.1% |
| Austrians | 97.8 /100 | #61 | Exceptional 10.1% |
| Immigrants | Italy | 97.8 /100 | #62 | Exceptional 10.2% |
| Slovaks | 97.7 /100 | #63 | Exceptional 10.2% |
| Swiss | 97.5 /100 | #64 | Exceptional 10.2% |
| Zimbabweans | 97.5 /100 | #65 | Exceptional 10.2% |
| Serbians | 97.5 /100 | #66 | Exceptional 10.2% |
| Immigrants | Netherlands | 97.3 /100 | #67 | Exceptional 10.2% |
| Immigrants | Sri Lanka | 97.2 /100 | #68 | Exceptional 10.2% |
| Immigrants | Australia | 97.1 /100 | #69 | Exceptional 10.2% |
| Paraguayans | 97.1 /100 | #70 | Exceptional 10.2% |
| Europeans | 97.1 /100 | #71 | Exceptional 10.2% |
| Immigrants | Canada | 97.1 /100 | #72 | Exceptional 10.2% |
| Immigrants | Asia | 97.0 /100 | #73 | Exceptional 10.2% |
| Immigrants | Eastern Europe | 96.9 /100 | #74 | Exceptional 10.2% |