Celtic vs Immigrants from Cabo Verde High School Diploma
COMPARE
Celtic
Immigrants from Cabo Verde
High School Diploma
High School Diploma Comparison
Celtics
Immigrants from Cabo Verde
90.6%
HIGH SCHOOL DIPLOMA
98.7/ 100
METRIC RATING
90th/ 347
METRIC RANK
83.3%
HIGH SCHOOL DIPLOMA
0.0/ 100
METRIC RATING
324th/ 347
METRIC RANK
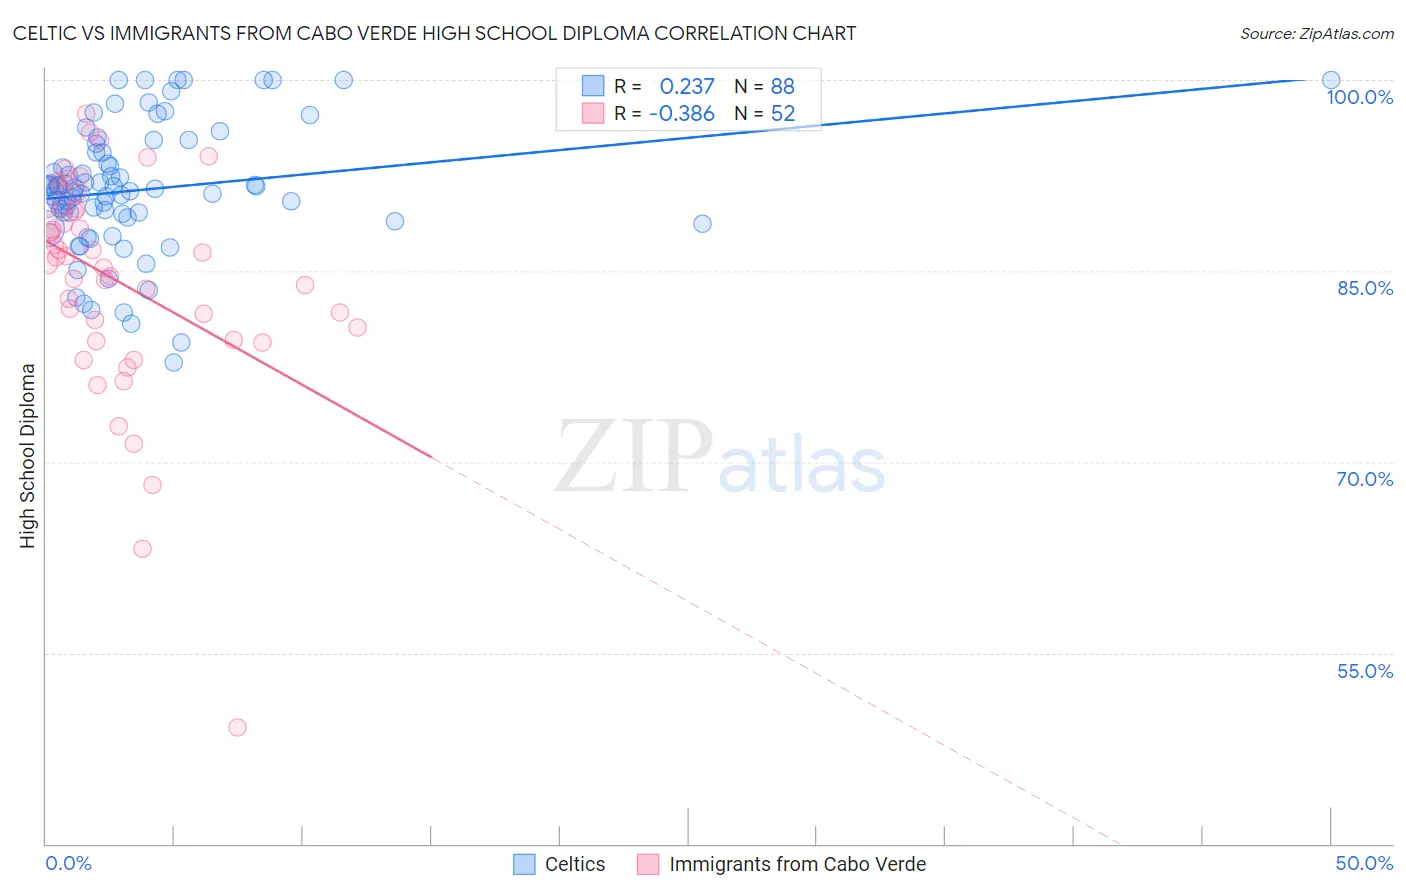
Celtic vs Immigrants from Cabo Verde High School Diploma Correlation Chart
The statistical analysis conducted on geographies consisting of 168,876,981 people shows a weak positive correlation between the proportion of Celtics and percentage of population with at least high school diploma education in the United States with a correlation coefficient (R) of 0.237 and weighted average of 90.6%. Similarly, the statistical analysis conducted on geographies consisting of 38,158,504 people shows a mild negative correlation between the proportion of Immigrants from Cabo Verde and percentage of population with at least high school diploma education in the United States with a correlation coefficient (R) of -0.386 and weighted average of 83.3%, a difference of 8.8%.
High School Diploma Correlation Summary
| Measurement | Celtic | Immigrants from Cabo Verde |
| Minimum | 77.8% | 49.2% |
| Maximum | 100.0% | 97.4% |
| Range | 22.2% | 48.2% |
| Mean | 91.4% | 84.2% |
| Median | 91.4% | 85.8% |
| Interquartile 25% (IQ1) | 89.3% | 80.1% |
| Interquartile 75% (IQ3) | 94.3% | 89.9% |
| Interquartile Range (IQR) | 5.0% | 9.8% |
| Standard Deviation (Sample) | 5.0% | 8.7% |
| Standard Deviation (Population) | 5.0% | 8.6% |
Similar Demographics by High School Diploma
Demographics Similar to Celtics by High School Diploma
In terms of high school diploma, the demographic groups most similar to Celtics are Canadian (90.6%, a difference of 0.010%), South African (90.6%, a difference of 0.020%), Immigrants from France (90.6%, a difference of 0.030%), Swiss (90.6%, a difference of 0.030%), and Immigrants from Western Europe (90.6%, a difference of 0.040%).
| Demographics | Rating | Rank | High School Diploma |
| Immigrants | Moldova | 99.2 /100 | #83 | Exceptional 90.7% |
| Immigrants | Saudi Arabia | 99.1 /100 | #84 | Exceptional 90.7% |
| Romanians | 98.9 /100 | #85 | Exceptional 90.7% |
| Immigrants | Bulgaria | 98.9 /100 | #86 | Exceptional 90.6% |
| Immigrants | Turkey | 98.9 /100 | #87 | Exceptional 90.6% |
| Immigrants | France | 98.8 /100 | #88 | Exceptional 90.6% |
| Canadians | 98.7 /100 | #89 | Exceptional 90.6% |
| Celtics | 98.7 /100 | #90 | Exceptional 90.6% |
| South Africans | 98.6 /100 | #91 | Exceptional 90.6% |
| Swiss | 98.6 /100 | #92 | Exceptional 90.6% |
| Immigrants | Western Europe | 98.6 /100 | #93 | Exceptional 90.6% |
| Immigrants | Israel | 98.5 /100 | #94 | Exceptional 90.5% |
| Icelanders | 98.5 /100 | #95 | Exceptional 90.5% |
| Immigrants | Serbia | 98.4 /100 | #96 | Exceptional 90.5% |
| Immigrants | Kuwait | 98.3 /100 | #97 | Exceptional 90.5% |
Demographics Similar to Immigrants from Cabo Verde by High School Diploma
In terms of high school diploma, the demographic groups most similar to Immigrants from Cabo Verde are Immigrants from Nicaragua (83.1%, a difference of 0.23%), Immigrants from Cuba (83.5%, a difference of 0.29%), Mexican American Indian (83.0%, a difference of 0.30%), Honduran (83.0%, a difference of 0.34%), and Dominican (82.9%, a difference of 0.39%).
| Demographics | Rating | Rank | High School Diploma |
| Immigrants | Caribbean | 0.0 /100 | #317 | Tragic 84.3% |
| Immigrants | Belize | 0.0 /100 | #318 | Tragic 84.2% |
| Central American Indians | 0.0 /100 | #319 | Tragic 84.2% |
| Nicaraguans | 0.0 /100 | #320 | Tragic 84.1% |
| Yuman | 0.0 /100 | #321 | Tragic 84.0% |
| Lumbee | 0.0 /100 | #322 | Tragic 83.6% |
| Immigrants | Cuba | 0.0 /100 | #323 | Tragic 83.5% |
| Immigrants | Cabo Verde | 0.0 /100 | #324 | Tragic 83.3% |
| Immigrants | Nicaragua | 0.0 /100 | #325 | Tragic 83.1% |
| Mexican American Indians | 0.0 /100 | #326 | Tragic 83.0% |
| Hondurans | 0.0 /100 | #327 | Tragic 83.0% |
| Dominicans | 0.0 /100 | #328 | Tragic 82.9% |
| Hispanics or Latinos | 0.0 /100 | #329 | Tragic 82.9% |
| Immigrants | Azores | 0.0 /100 | #330 | Tragic 82.8% |
| Central Americans | 0.0 /100 | #331 | Tragic 82.5% |