Immigrants from Scotland vs Immigrants from Cabo Verde Single Male Poverty
COMPARE
Immigrants from Scotland
Immigrants from Cabo Verde
Single Male Poverty
Single Male Poverty Comparison
Immigrants from Scotland
Immigrants from Cabo Verde
12.7%
SINGLE MALE POVERTY
68.9/ 100
METRIC RATING
154th/ 347
METRIC RANK
13.9%
SINGLE MALE POVERTY
0.1/ 100
METRIC RATING
266th/ 347
METRIC RANK
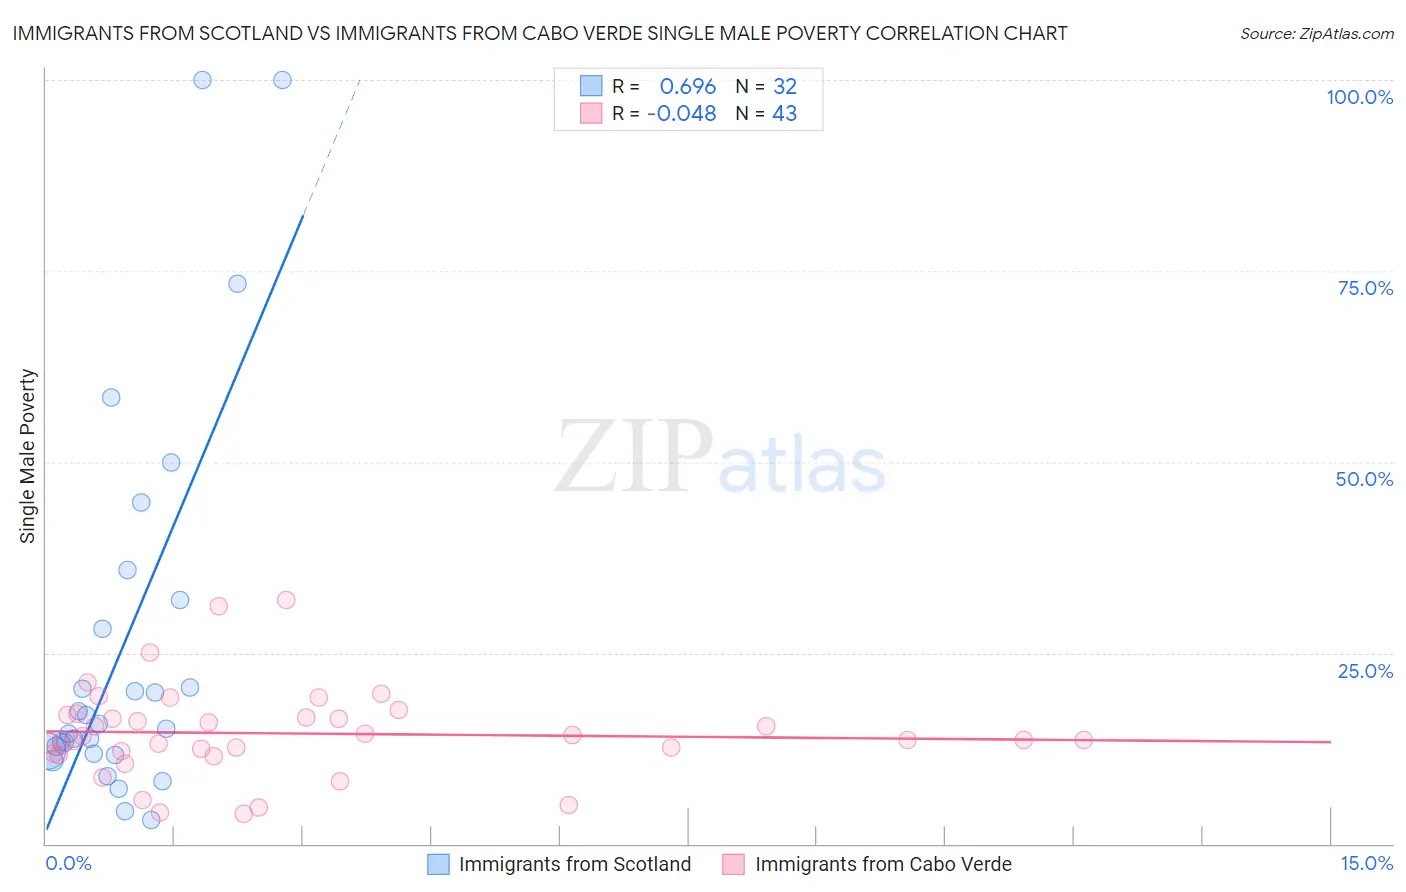
Immigrants from Scotland vs Immigrants from Cabo Verde Single Male Poverty Correlation Chart
The statistical analysis conducted on geographies consisting of 179,195,649 people shows a significant positive correlation between the proportion of Immigrants from Scotland and poverty level among single males in the United States with a correlation coefficient (R) of 0.696 and weighted average of 12.7%. Similarly, the statistical analysis conducted on geographies consisting of 36,518,320 people shows no correlation between the proportion of Immigrants from Cabo Verde and poverty level among single males in the United States with a correlation coefficient (R) of -0.048 and weighted average of 13.9%, a difference of 9.9%.
Single Male Poverty Correlation Summary
| Measurement | Immigrants from Scotland | Immigrants from Cabo Verde |
| Minimum | 3.1% | 4.0% |
| Maximum | 100.0% | 31.9% |
| Range | 96.9% | 27.9% |
| Mean | 25.8% | 14.4% |
| Median | 15.4% | 13.6% |
| Interquartile 25% (IQ1) | 11.9% | 11.8% |
| Interquartile 75% (IQ3) | 30.0% | 16.9% |
| Interquartile Range (IQR) | 18.1% | 5.2% |
| Standard Deviation (Sample) | 25.1% | 6.0% |
| Standard Deviation (Population) | 24.7% | 5.9% |
Similar Demographics by Single Male Poverty
Demographics Similar to Immigrants from Scotland by Single Male Poverty
In terms of single male poverty, the demographic groups most similar to Immigrants from Scotland are Immigrants from Spain (12.7%, a difference of 0.020%), Vietnamese (12.7%, a difference of 0.060%), Latvian (12.7%, a difference of 0.060%), Immigrants (12.7%, a difference of 0.070%), and Australian (12.6%, a difference of 0.16%).
| Demographics | Rating | Rank | Single Male Poverty |
| Malaysians | 74.8 /100 | #147 | Good 12.6% |
| Yugoslavians | 73.9 /100 | #148 | Good 12.6% |
| Sierra Leoneans | 73.0 /100 | #149 | Good 12.6% |
| Immigrants | Panama | 72.1 /100 | #150 | Good 12.6% |
| Immigrants | Hungary | 71.9 /100 | #151 | Good 12.6% |
| Australians | 71.4 /100 | #152 | Good 12.6% |
| Immigrants | Immigrants | 70.1 /100 | #153 | Good 12.7% |
| Immigrants | Scotland | 68.9 /100 | #154 | Good 12.7% |
| Immigrants | Spain | 68.7 /100 | #155 | Good 12.7% |
| Vietnamese | 67.9 /100 | #156 | Good 12.7% |
| Latvians | 67.9 /100 | #157 | Good 12.7% |
| Immigrants | Middle Africa | 64.9 /100 | #158 | Good 12.7% |
| Immigrants | Liberia | 64.2 /100 | #159 | Good 12.7% |
| Greeks | 64.1 /100 | #160 | Good 12.7% |
| Immigrants | Africa | 63.4 /100 | #161 | Good 12.7% |
Demographics Similar to Immigrants from Cabo Verde by Single Male Poverty
In terms of single male poverty, the demographic groups most similar to Immigrants from Cabo Verde are German (13.9%, a difference of 0.16%), Immigrants from Mexico (13.9%, a difference of 0.23%), Immigrants from Congo (13.9%, a difference of 0.31%), Scottish (14.0%, a difference of 0.38%), and Immigrants from Saudi Arabia (14.0%, a difference of 0.40%).
| Demographics | Rating | Rank | Single Male Poverty |
| Guatemalans | 0.3 /100 | #259 | Tragic 13.8% |
| Swiss | 0.3 /100 | #260 | Tragic 13.8% |
| Hungarians | 0.3 /100 | #261 | Tragic 13.8% |
| Fijians | 0.3 /100 | #262 | Tragic 13.8% |
| Cape Verdeans | 0.2 /100 | #263 | Tragic 13.8% |
| West Indians | 0.2 /100 | #264 | Tragic 13.8% |
| Immigrants | Congo | 0.2 /100 | #265 | Tragic 13.9% |
| Immigrants | Cabo Verde | 0.1 /100 | #266 | Tragic 13.9% |
| Germans | 0.1 /100 | #267 | Tragic 13.9% |
| Immigrants | Mexico | 0.1 /100 | #268 | Tragic 13.9% |
| Scottish | 0.1 /100 | #269 | Tragic 14.0% |
| Immigrants | Saudi Arabia | 0.1 /100 | #270 | Tragic 14.0% |
| Irish | 0.1 /100 | #271 | Tragic 14.0% |
| Mexicans | 0.1 /100 | #272 | Tragic 14.0% |
| Welsh | 0.1 /100 | #273 | Tragic 14.0% |