Celtic vs Immigrants from the Azores Family Poverty
COMPARE
Celtic
Immigrants from the Azores
Family Poverty
Family Poverty Comparison
Celtics
Immigrants from the Azores
8.8%
FAMILY POVERTY
64.9/ 100
METRIC RATING
164th/ 347
METRIC RANK
10.3%
FAMILY POVERTY
1.4/ 100
METRIC RATING
240th/ 347
METRIC RANK
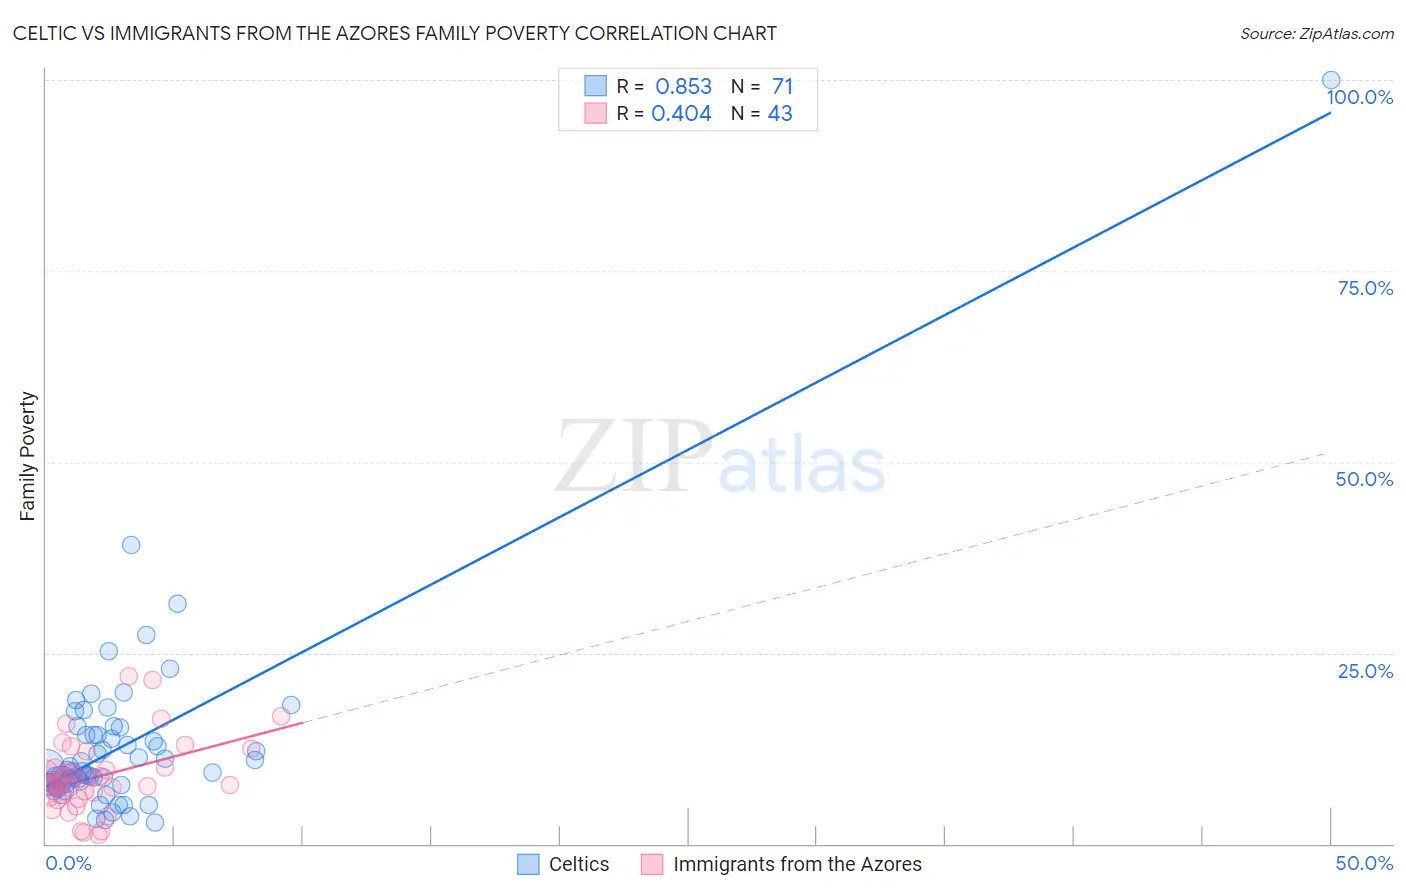
Celtic vs Immigrants from the Azores Family Poverty Correlation Chart
The statistical analysis conducted on geographies consisting of 168,628,915 people shows a very strong positive correlation between the proportion of Celtics and poverty level among families in the United States with a correlation coefficient (R) of 0.853 and weighted average of 8.8%. Similarly, the statistical analysis conducted on geographies consisting of 46,193,848 people shows a moderate positive correlation between the proportion of Immigrants from the Azores and poverty level among families in the United States with a correlation coefficient (R) of 0.404 and weighted average of 10.3%, a difference of 16.4%.
Family Poverty Correlation Summary
| Measurement | Celtic | Immigrants from the Azores |
| Minimum | 2.8% | 1.2% |
| Maximum | 100.0% | 21.9% |
| Range | 97.2% | 20.7% |
| Mean | 12.7% | 8.8% |
| Median | 9.4% | 7.8% |
| Interquartile 25% (IQ1) | 7.6% | 6.1% |
| Interquartile 75% (IQ3) | 14.2% | 10.0% |
| Interquartile Range (IQR) | 6.6% | 3.8% |
| Standard Deviation (Sample) | 12.4% | 4.7% |
| Standard Deviation (Population) | 12.3% | 4.7% |
Similar Demographics by Family Poverty
Demographics Similar to Celtics by Family Poverty
In terms of family poverty, the demographic groups most similar to Celtics are Guamanian/Chamorro (8.8%, a difference of 0.030%), Pennsylvania German (8.8%, a difference of 0.16%), Ethiopian (8.8%, a difference of 0.21%), Afghan (8.8%, a difference of 0.21%), and Immigrants from Northern Africa (8.8%, a difference of 0.30%).
| Demographics | Rating | Rank | Family Poverty |
| Tsimshian | 69.3 /100 | #157 | Good 8.8% |
| Whites/Caucasians | 69.1 /100 | #158 | Good 8.8% |
| Peruvians | 68.0 /100 | #159 | Good 8.8% |
| Hungarians | 67.2 /100 | #160 | Good 8.8% |
| Immigrants | Northern Africa | 66.9 /100 | #161 | Good 8.8% |
| Ethiopians | 66.3 /100 | #162 | Good 8.8% |
| Pennsylvania Germans | 66.0 /100 | #163 | Good 8.8% |
| Celtics | 64.9 /100 | #164 | Good 8.8% |
| Guamanians/Chamorros | 64.7 /100 | #165 | Good 8.8% |
| Afghans | 63.5 /100 | #166 | Good 8.8% |
| Immigrants | Ethiopia | 62.5 /100 | #167 | Good 8.9% |
| Israelis | 62.1 /100 | #168 | Good 8.9% |
| Immigrants | Chile | 59.6 /100 | #169 | Average 8.9% |
| Kenyans | 58.2 /100 | #170 | Average 8.9% |
| Lebanese | 57.6 /100 | #171 | Average 8.9% |
Demographics Similar to Immigrants from the Azores by Family Poverty
In terms of family poverty, the demographic groups most similar to Immigrants from the Azores are Ghanaian (10.3%, a difference of 0.090%), Potawatomi (10.2%, a difference of 0.31%), French American Indian (10.2%, a difference of 0.35%), Immigrants from Laos (10.2%, a difference of 0.71%), and Alaska Native (10.4%, a difference of 0.95%).
| Demographics | Rating | Rank | Family Poverty |
| Fijians | 2.1 /100 | #233 | Tragic 10.1% |
| Immigrants | Middle Africa | 2.1 /100 | #234 | Tragic 10.1% |
| Nigerians | 2.0 /100 | #235 | Tragic 10.1% |
| Immigrants | Nigeria | 1.9 /100 | #236 | Tragic 10.2% |
| Immigrants | Laos | 1.7 /100 | #237 | Tragic 10.2% |
| French American Indians | 1.5 /100 | #238 | Tragic 10.2% |
| Potawatomi | 1.5 /100 | #239 | Tragic 10.2% |
| Immigrants | Azores | 1.4 /100 | #240 | Tragic 10.3% |
| Ghanaians | 1.3 /100 | #241 | Tragic 10.3% |
| Alaska Natives | 1.0 /100 | #242 | Tragic 10.4% |
| Nepalese | 0.8 /100 | #243 | Tragic 10.4% |
| Cree | 0.7 /100 | #244 | Tragic 10.5% |
| Immigrants | Burma/Myanmar | 0.6 /100 | #245 | Tragic 10.5% |
| Cherokee | 0.5 /100 | #246 | Tragic 10.6% |
| Liberians | 0.4 /100 | #247 | Tragic 10.6% |