Celtic vs Immigrants from the Azores Median Male Earnings
COMPARE
Celtic
Immigrants from the Azores
Median Male Earnings
Median Male Earnings Comparison
Celtics
Immigrants from the Azores
$54,242
MEDIAN MALE EARNINGS
43.9/ 100
METRIC RATING
179th/ 347
METRIC RANK
$53,503
MEDIAN MALE EARNINGS
27.5/ 100
METRIC RATING
195th/ 347
METRIC RANK
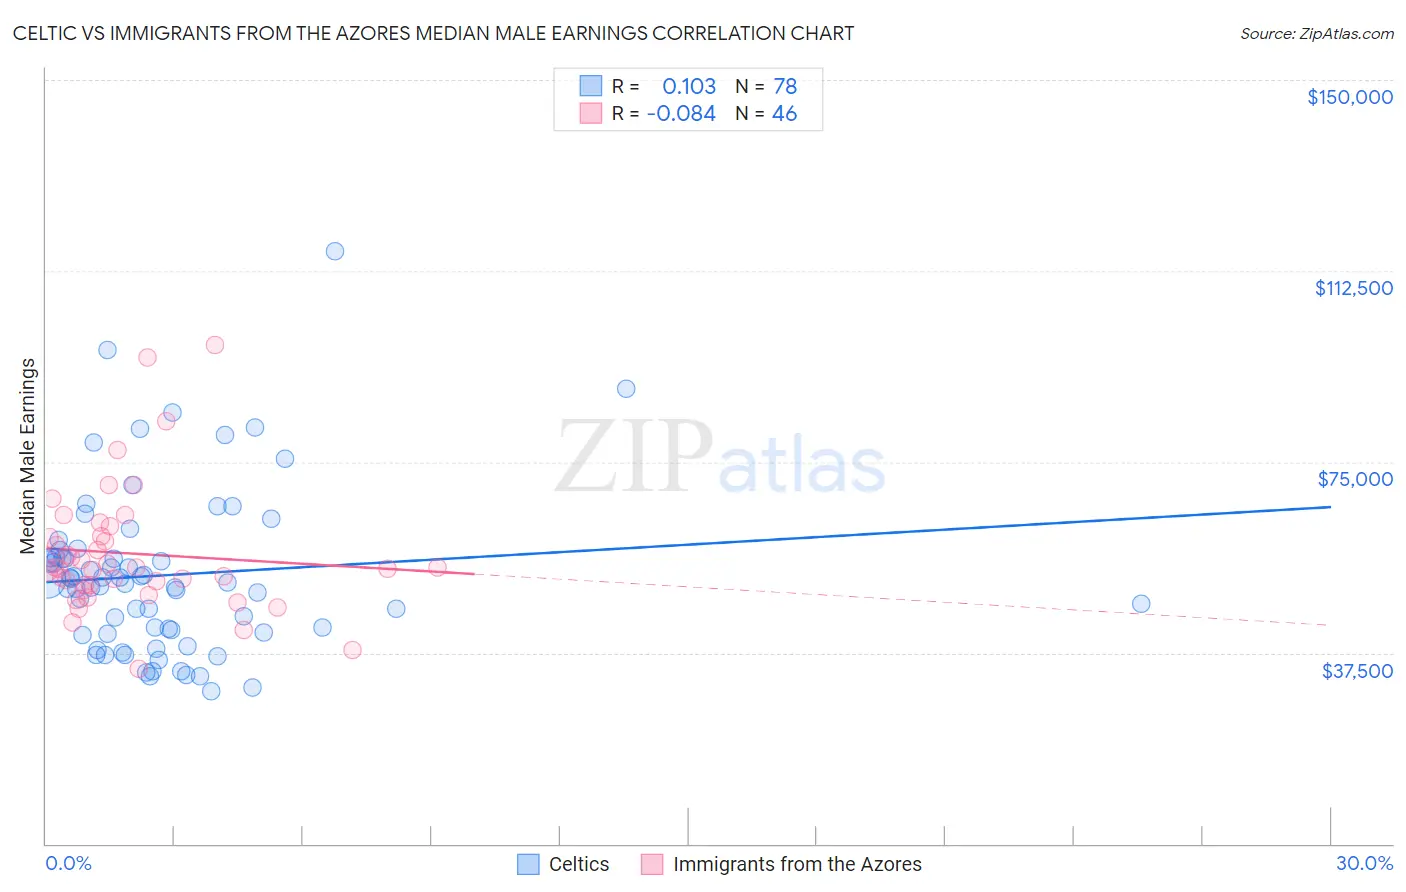
Celtic vs Immigrants from the Azores Median Male Earnings Correlation Chart
The statistical analysis conducted on geographies consisting of 168,835,253 people shows a poor positive correlation between the proportion of Celtics and median male earnings in the United States with a correlation coefficient (R) of 0.103 and weighted average of $54,242. Similarly, the statistical analysis conducted on geographies consisting of 46,248,133 people shows a slight negative correlation between the proportion of Immigrants from the Azores and median male earnings in the United States with a correlation coefficient (R) of -0.084 and weighted average of $53,503, a difference of 1.4%.
Median Male Earnings Correlation Summary
| Measurement | Celtic | Immigrants from the Azores |
| Minimum | $30,000 | $34,438 |
| Maximum | $116,250 | $98,000 |
| Range | $86,250 | $63,562 |
| Mean | $52,737 | $56,998 |
| Median | $51,157 | $54,107 |
| Interquartile 25% (IQ1) | $41,563 | $50,771 |
| Interquartile 75% (IQ3) | $56,235 | $60,281 |
| Interquartile Range (IQR) | $14,672 | $9,510 |
| Standard Deviation (Sample) | $16,099 | $12,557 |
| Standard Deviation (Population) | $15,995 | $12,419 |
Demographics Similar to Celtics and Immigrants from the Azores by Median Male Earnings
In terms of median male earnings, the demographic groups most similar to Celtics are Costa Rican ($54,279, a difference of 0.070%), Sierra Leonean ($54,279, a difference of 0.070%), Iraqi ($54,182, a difference of 0.11%), Immigrants ($54,168, a difference of 0.14%), and Yugoslavian ($53,967, a difference of 0.51%). Similarly, the demographic groups most similar to Immigrants from the Azores are Immigrants from Africa ($53,457, a difference of 0.090%), Spanish ($53,576, a difference of 0.14%), Immigrants from Kenya ($53,427, a difference of 0.14%), Kenyan ($53,647, a difference of 0.27%), and Scotch-Irish ($53,658, a difference of 0.29%).
| Demographics | Rating | Rank | Median Male Earnings |
| Costa Ricans | 44.8 /100 | #177 | Average $54,279 |
| Sierra Leoneans | 44.8 /100 | #178 | Average $54,279 |
| Celtics | 43.9 /100 | #179 | Average $54,242 |
| Iraqis | 42.5 /100 | #180 | Average $54,182 |
| Immigrants | Immigrants | 42.1 /100 | #181 | Average $54,168 |
| Yugoslavians | 37.4 /100 | #182 | Fair $53,967 |
| Immigrants | South America | 37.3 /100 | #183 | Fair $53,962 |
| Whites/Caucasians | 36.5 /100 | #184 | Fair $53,925 |
| Immigrants | Sierra Leone | 36.0 /100 | #185 | Fair $53,905 |
| Colombians | 34.4 /100 | #186 | Fair $53,832 |
| Immigrants | Eritrea | 31.8 /100 | #187 | Fair $53,715 |
| Immigrants | Eastern Africa | 31.8 /100 | #188 | Fair $53,713 |
| Puget Sound Salish | 31.6 /100 | #189 | Fair $53,704 |
| Uruguayans | 31.1 /100 | #190 | Fair $53,680 |
| Guamanians/Chamorros | 30.7 /100 | #191 | Fair $53,661 |
| Scotch-Irish | 30.6 /100 | #192 | Fair $53,658 |
| Kenyans | 30.4 /100 | #193 | Fair $53,647 |
| Spanish | 29.0 /100 | #194 | Fair $53,576 |
| Immigrants | Azores | 27.5 /100 | #195 | Fair $53,503 |
| Immigrants | Africa | 26.6 /100 | #196 | Fair $53,457 |
| Immigrants | Kenya | 26.0 /100 | #197 | Fair $53,427 |