Celtic vs Immigrants from Belize Family Poverty
COMPARE
Celtic
Immigrants from Belize
Family Poverty
Family Poverty Comparison
Celtics
Immigrants from Belize
8.8%
FAMILY POVERTY
64.9/ 100
METRIC RATING
164th/ 347
METRIC RANK
11.5%
FAMILY POVERTY
0.0/ 100
METRIC RATING
288th/ 347
METRIC RANK
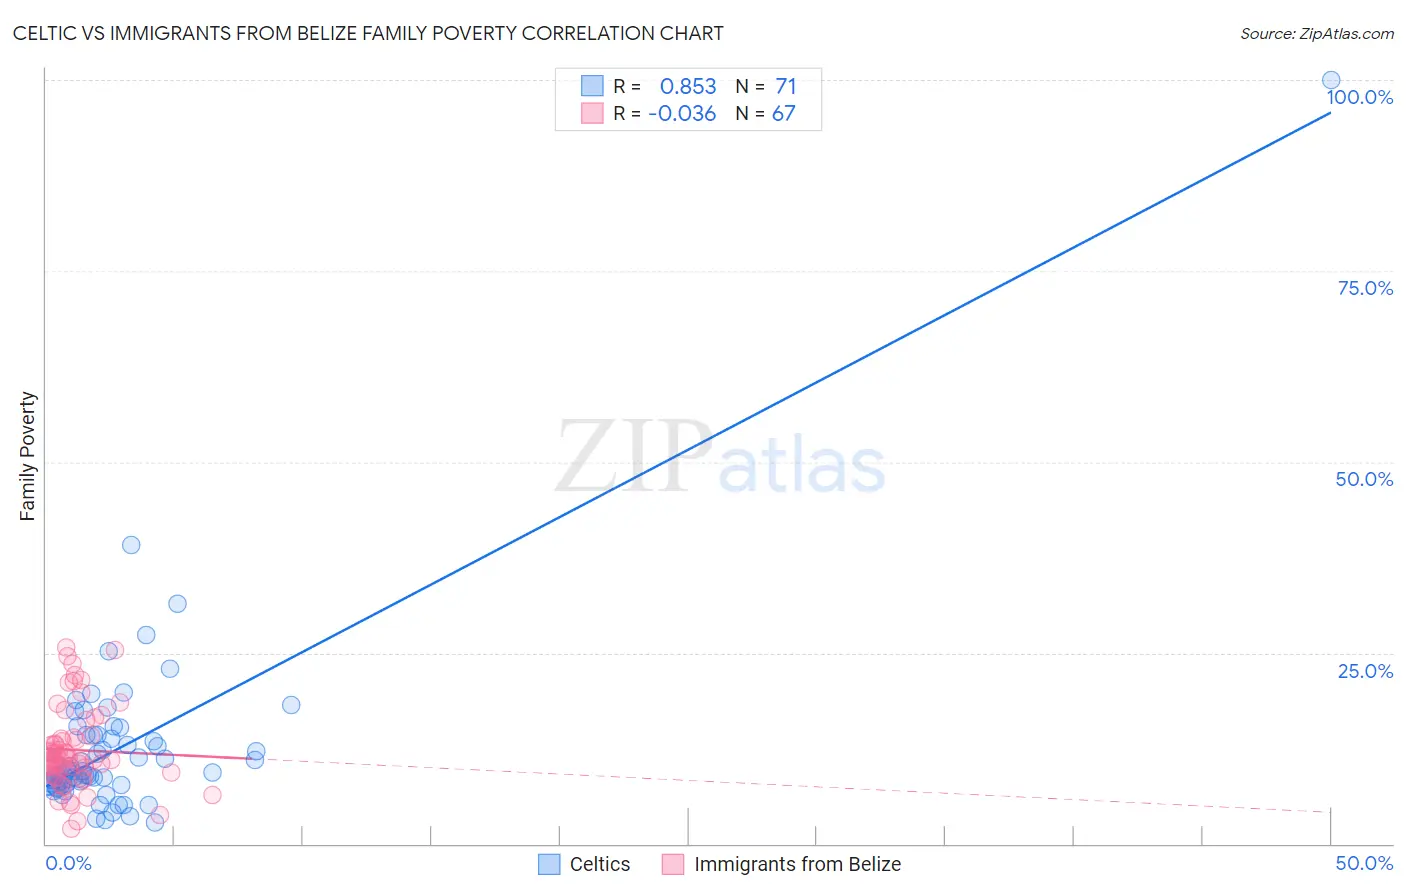
Celtic vs Immigrants from Belize Family Poverty Correlation Chart
The statistical analysis conducted on geographies consisting of 168,628,915 people shows a very strong positive correlation between the proportion of Celtics and poverty level among families in the United States with a correlation coefficient (R) of 0.853 and weighted average of 8.8%. Similarly, the statistical analysis conducted on geographies consisting of 130,249,442 people shows no correlation between the proportion of Immigrants from Belize and poverty level among families in the United States with a correlation coefficient (R) of -0.036 and weighted average of 11.5%, a difference of 30.5%.
Family Poverty Correlation Summary
| Measurement | Celtic | Immigrants from Belize |
| Minimum | 2.8% | 2.0% |
| Maximum | 100.0% | 25.6% |
| Range | 97.2% | 23.6% |
| Mean | 12.7% | 12.3% |
| Median | 9.4% | 10.9% |
| Interquartile 25% (IQ1) | 7.6% | 9.4% |
| Interquartile 75% (IQ3) | 14.2% | 13.8% |
| Interquartile Range (IQR) | 6.6% | 4.4% |
| Standard Deviation (Sample) | 12.4% | 5.3% |
| Standard Deviation (Population) | 12.3% | 5.3% |
Similar Demographics by Family Poverty
Demographics Similar to Celtics by Family Poverty
In terms of family poverty, the demographic groups most similar to Celtics are Guamanian/Chamorro (8.8%, a difference of 0.030%), Pennsylvania German (8.8%, a difference of 0.16%), Ethiopian (8.8%, a difference of 0.21%), Afghan (8.8%, a difference of 0.21%), and Immigrants from Northern Africa (8.8%, a difference of 0.30%).
| Demographics | Rating | Rank | Family Poverty |
| Tsimshian | 69.3 /100 | #157 | Good 8.8% |
| Whites/Caucasians | 69.1 /100 | #158 | Good 8.8% |
| Peruvians | 68.0 /100 | #159 | Good 8.8% |
| Hungarians | 67.2 /100 | #160 | Good 8.8% |
| Immigrants | Northern Africa | 66.9 /100 | #161 | Good 8.8% |
| Ethiopians | 66.3 /100 | #162 | Good 8.8% |
| Pennsylvania Germans | 66.0 /100 | #163 | Good 8.8% |
| Celtics | 64.9 /100 | #164 | Good 8.8% |
| Guamanians/Chamorros | 64.7 /100 | #165 | Good 8.8% |
| Afghans | 63.5 /100 | #166 | Good 8.8% |
| Immigrants | Ethiopia | 62.5 /100 | #167 | Good 8.9% |
| Israelis | 62.1 /100 | #168 | Good 8.9% |
| Immigrants | Chile | 59.6 /100 | #169 | Average 8.9% |
| Kenyans | 58.2 /100 | #170 | Average 8.9% |
| Lebanese | 57.6 /100 | #171 | Average 8.9% |
Demographics Similar to Immigrants from Belize by Family Poverty
In terms of family poverty, the demographic groups most similar to Immigrants from Belize are Immigrants from Barbados (11.5%, a difference of 0.050%), West Indian (11.5%, a difference of 0.060%), Haitian (11.5%, a difference of 0.12%), Vietnamese (11.5%, a difference of 0.19%), and Immigrants from Somalia (11.5%, a difference of 0.22%).
| Demographics | Rating | Rank | Family Poverty |
| Immigrants | West Indies | 0.0 /100 | #281 | Tragic 11.3% |
| Immigrants | Cuba | 0.0 /100 | #282 | Tragic 11.3% |
| Indonesians | 0.0 /100 | #283 | Tragic 11.3% |
| Yaqui | 0.0 /100 | #284 | Tragic 11.3% |
| Barbadians | 0.0 /100 | #285 | Tragic 11.3% |
| Senegalese | 0.0 /100 | #286 | Tragic 11.5% |
| Vietnamese | 0.0 /100 | #287 | Tragic 11.5% |
| Immigrants | Belize | 0.0 /100 | #288 | Tragic 11.5% |
| Immigrants | Barbados | 0.0 /100 | #289 | Tragic 11.5% |
| West Indians | 0.0 /100 | #290 | Tragic 11.5% |
| Haitians | 0.0 /100 | #291 | Tragic 11.5% |
| Immigrants | Somalia | 0.0 /100 | #292 | Tragic 11.5% |
| Immigrants | Cabo Verde | 0.0 /100 | #293 | Tragic 11.6% |
| Immigrants | St. Vincent and the Grenadines | 0.0 /100 | #294 | Tragic 11.6% |
| Immigrants | Haiti | 0.0 /100 | #295 | Tragic 11.6% |