Celtic vs Immigrants from Ecuador Family Poverty
COMPARE
Celtic
Immigrants from Ecuador
Family Poverty
Family Poverty Comparison
Celtics
Immigrants from Ecuador
8.8%
FAMILY POVERTY
64.9/ 100
METRIC RATING
164th/ 347
METRIC RANK
11.1%
FAMILY POVERTY
0.1/ 100
METRIC RATING
269th/ 347
METRIC RANK
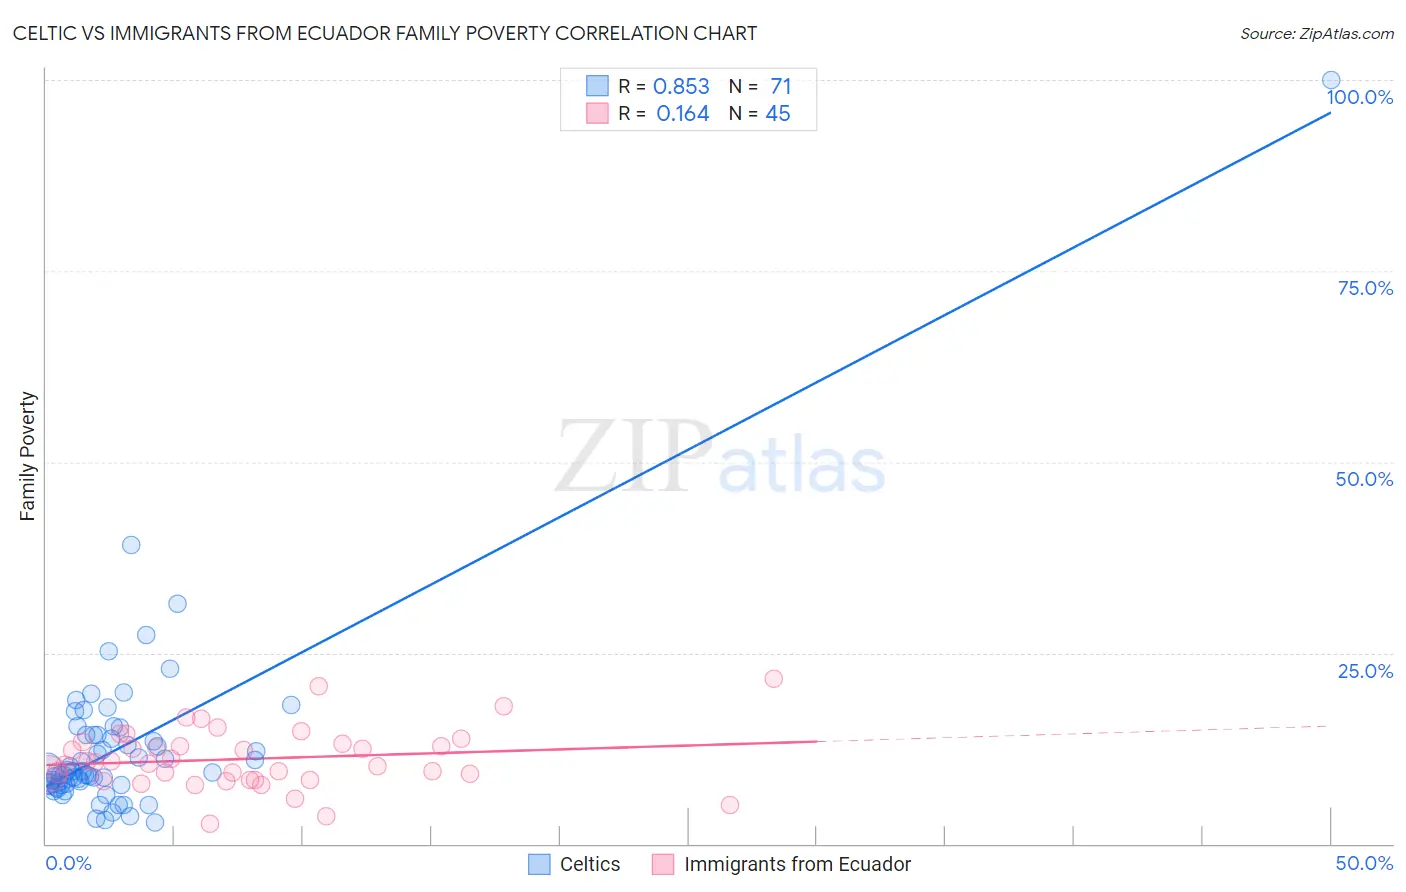
Celtic vs Immigrants from Ecuador Family Poverty Correlation Chart
The statistical analysis conducted on geographies consisting of 168,628,915 people shows a very strong positive correlation between the proportion of Celtics and poverty level among families in the United States with a correlation coefficient (R) of 0.853 and weighted average of 8.8%. Similarly, the statistical analysis conducted on geographies consisting of 270,551,219 people shows a poor positive correlation between the proportion of Immigrants from Ecuador and poverty level among families in the United States with a correlation coefficient (R) of 0.164 and weighted average of 11.1%, a difference of 25.9%.
Family Poverty Correlation Summary
| Measurement | Celtic | Immigrants from Ecuador |
| Minimum | 2.8% | 2.6% |
| Maximum | 100.0% | 21.7% |
| Range | 97.2% | 19.1% |
| Mean | 12.7% | 11.1% |
| Median | 9.4% | 10.6% |
| Interquartile 25% (IQ1) | 7.6% | 8.4% |
| Interquartile 75% (IQ3) | 14.2% | 13.2% |
| Interquartile Range (IQR) | 6.6% | 4.8% |
| Standard Deviation (Sample) | 12.4% | 3.9% |
| Standard Deviation (Population) | 12.3% | 3.9% |
Similar Demographics by Family Poverty
Demographics Similar to Celtics by Family Poverty
In terms of family poverty, the demographic groups most similar to Celtics are Guamanian/Chamorro (8.8%, a difference of 0.030%), Pennsylvania German (8.8%, a difference of 0.16%), Ethiopian (8.8%, a difference of 0.21%), Afghan (8.8%, a difference of 0.21%), and Immigrants from Northern Africa (8.8%, a difference of 0.30%).
| Demographics | Rating | Rank | Family Poverty |
| Tsimshian | 69.3 /100 | #157 | Good 8.8% |
| Whites/Caucasians | 69.1 /100 | #158 | Good 8.8% |
| Peruvians | 68.0 /100 | #159 | Good 8.8% |
| Hungarians | 67.2 /100 | #160 | Good 8.8% |
| Immigrants | Northern Africa | 66.9 /100 | #161 | Good 8.8% |
| Ethiopians | 66.3 /100 | #162 | Good 8.8% |
| Pennsylvania Germans | 66.0 /100 | #163 | Good 8.8% |
| Celtics | 64.9 /100 | #164 | Good 8.8% |
| Guamanians/Chamorros | 64.7 /100 | #165 | Good 8.8% |
| Afghans | 63.5 /100 | #166 | Good 8.8% |
| Immigrants | Ethiopia | 62.5 /100 | #167 | Good 8.9% |
| Israelis | 62.1 /100 | #168 | Good 8.9% |
| Immigrants | Chile | 59.6 /100 | #169 | Average 8.9% |
| Kenyans | 58.2 /100 | #170 | Average 8.9% |
| Lebanese | 57.6 /100 | #171 | Average 8.9% |
Demographics Similar to Immigrants from Ecuador by Family Poverty
In terms of family poverty, the demographic groups most similar to Immigrants from Ecuador are Immigrants from Nicaragua (11.1%, a difference of 0.010%), Immigrants from Bahamas (11.1%, a difference of 0.25%), Immigrants from Jamaica (11.2%, a difference of 0.35%), Jamaican (11.1%, a difference of 0.48%), and Comanche (11.0%, a difference of 0.58%).
| Demographics | Rating | Rank | Family Poverty |
| Spanish American Indians | 0.2 /100 | #262 | Tragic 10.9% |
| Cape Verdeans | 0.1 /100 | #263 | Tragic 10.9% |
| Trinidadians and Tobagonians | 0.1 /100 | #264 | Tragic 10.9% |
| Immigrants | Trinidad and Tobago | 0.1 /100 | #265 | Tragic 10.9% |
| Immigrants | El Salvador | 0.1 /100 | #266 | Tragic 11.0% |
| Comanche | 0.1 /100 | #267 | Tragic 11.0% |
| Jamaicans | 0.1 /100 | #268 | Tragic 11.1% |
| Immigrants | Ecuador | 0.1 /100 | #269 | Tragic 11.1% |
| Immigrants | Nicaragua | 0.1 /100 | #270 | Tragic 11.1% |
| Immigrants | Bahamas | 0.1 /100 | #271 | Tragic 11.1% |
| Immigrants | Jamaica | 0.1 /100 | #272 | Tragic 11.2% |
| Somalis | 0.1 /100 | #273 | Tragic 11.2% |
| Spanish Americans | 0.1 /100 | #274 | Tragic 11.2% |
| Central Americans | 0.1 /100 | #275 | Tragic 11.2% |
| Immigrants | Guyana | 0.1 /100 | #276 | Tragic 11.2% |