Immigrants from Uzbekistan vs Basque Family Poverty
COMPARE
Immigrants from Uzbekistan
Basque
Family Poverty
Family Poverty Comparison
Immigrants from Uzbekistan
Basques
10.0%
FAMILY POVERTY
3.1/ 100
METRIC RATING
229th/ 347
METRIC RANK
8.1%
FAMILY POVERTY
94.9/ 100
METRIC RATING
108th/ 347
METRIC RANK
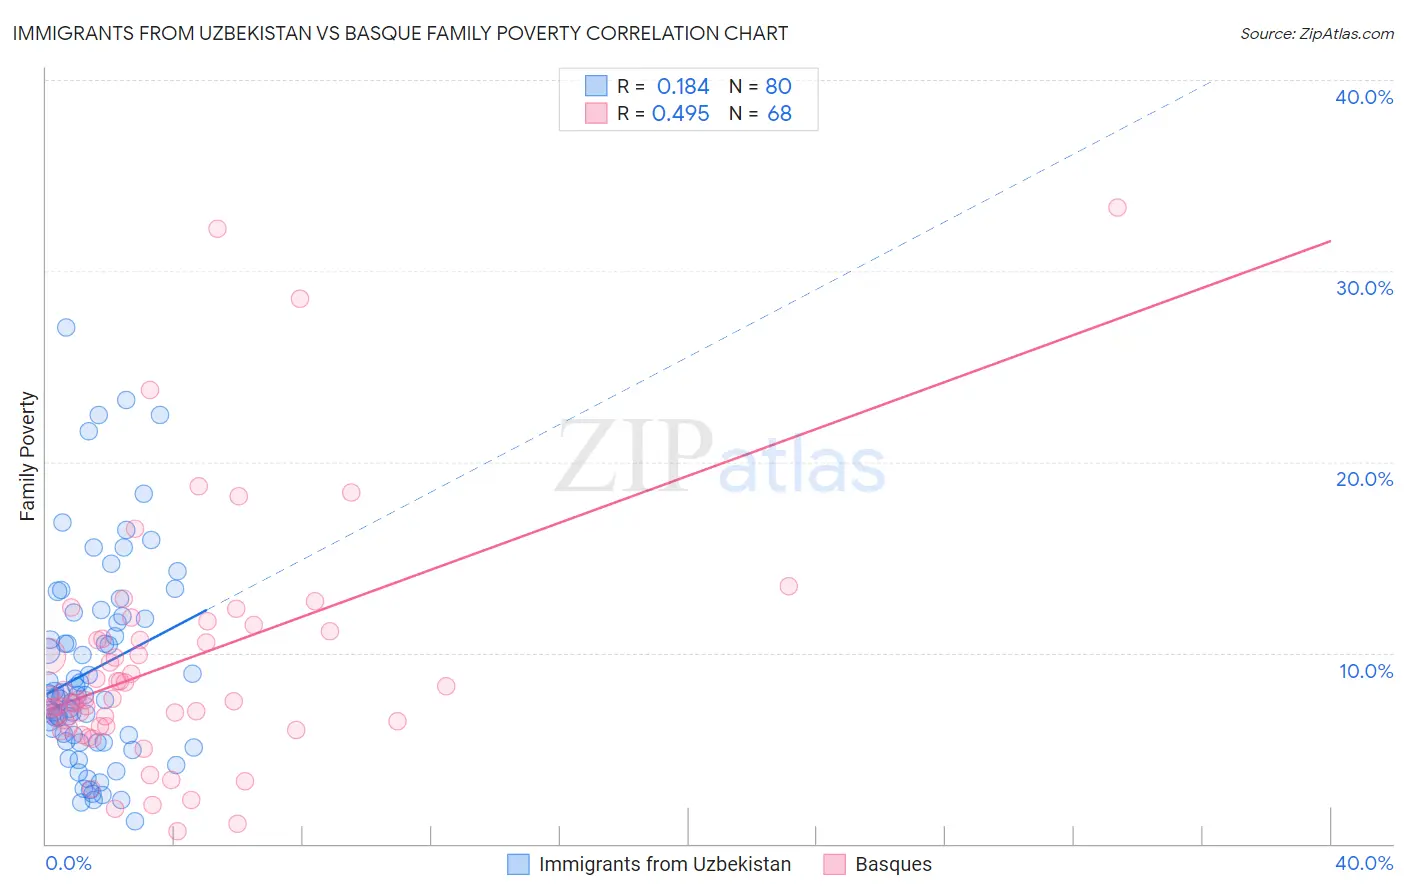
Immigrants from Uzbekistan vs Basque Family Poverty Correlation Chart
The statistical analysis conducted on geographies consisting of 118,666,742 people shows a poor positive correlation between the proportion of Immigrants from Uzbekistan and poverty level among families in the United States with a correlation coefficient (R) of 0.184 and weighted average of 10.0%. Similarly, the statistical analysis conducted on geographies consisting of 165,603,932 people shows a moderate positive correlation between the proportion of Basques and poverty level among families in the United States with a correlation coefficient (R) of 0.495 and weighted average of 8.1%, a difference of 23.1%.
Family Poverty Correlation Summary
| Measurement | Immigrants from Uzbekistan | Basque |
| Minimum | 1.2% | 0.66% |
| Maximum | 27.0% | 33.3% |
| Range | 25.8% | 32.7% |
| Mean | 9.1% | 9.4% |
| Median | 7.8% | 7.6% |
| Interquartile 25% (IQ1) | 5.3% | 6.2% |
| Interquartile 75% (IQ3) | 11.9% | 10.9% |
| Interquartile Range (IQR) | 6.5% | 4.8% |
| Standard Deviation (Sample) | 5.4% | 6.4% |
| Standard Deviation (Population) | 5.4% | 6.3% |
Similar Demographics by Family Poverty
Demographics Similar to Immigrants from Uzbekistan by Family Poverty
In terms of family poverty, the demographic groups most similar to Immigrants from Uzbekistan are Sudanese (10.0%, a difference of 0.010%), Immigrants from Panama (10.0%, a difference of 0.020%), Immigrants from Armenia (10.0%, a difference of 0.21%), Ottawa (10.0%, a difference of 0.23%), and Alaskan Athabascan (10.1%, a difference of 0.40%).
| Demographics | Rating | Rank | Family Poverty |
| Japanese | 4.8 /100 | #222 | Tragic 9.9% |
| Immigrants | Africa | 4.3 /100 | #223 | Tragic 9.9% |
| Marshallese | 3.9 /100 | #224 | Tragic 9.9% |
| Immigrants | Immigrants | 3.6 /100 | #225 | Tragic 10.0% |
| Ottawa | 3.3 /100 | #226 | Tragic 10.0% |
| Immigrants | Armenia | 3.3 /100 | #227 | Tragic 10.0% |
| Sudanese | 3.1 /100 | #228 | Tragic 10.0% |
| Immigrants | Uzbekistan | 3.1 /100 | #229 | Tragic 10.0% |
| Immigrants | Panama | 3.1 /100 | #230 | Tragic 10.0% |
| Alaskan Athabascans | 2.7 /100 | #231 | Tragic 10.1% |
| Immigrants | Sudan | 2.3 /100 | #232 | Tragic 10.1% |
| Fijians | 2.1 /100 | #233 | Tragic 10.1% |
| Immigrants | Middle Africa | 2.1 /100 | #234 | Tragic 10.1% |
| Nigerians | 2.0 /100 | #235 | Tragic 10.1% |
| Immigrants | Nigeria | 1.9 /100 | #236 | Tragic 10.2% |
Demographics Similar to Basques by Family Poverty
In terms of family poverty, the demographic groups most similar to Basques are French Canadian (8.1%, a difference of 0.090%), Jordanian (8.2%, a difference of 0.090%), Egyptian (8.1%, a difference of 0.13%), Romanian (8.2%, a difference of 0.18%), and Taiwanese (8.2%, a difference of 0.23%).
| Demographics | Rating | Rank | Family Poverty |
| Immigrants | Norway | 95.7 /100 | #101 | Exceptional 8.1% |
| Immigrants | Indonesia | 95.7 /100 | #102 | Exceptional 8.1% |
| Immigrants | Eastern Europe | 95.6 /100 | #103 | Exceptional 8.1% |
| Slavs | 95.6 /100 | #104 | Exceptional 8.1% |
| Laotians | 95.6 /100 | #105 | Exceptional 8.1% |
| Egyptians | 95.1 /100 | #106 | Exceptional 8.1% |
| French Canadians | 95.0 /100 | #107 | Exceptional 8.1% |
| Basques | 94.9 /100 | #108 | Exceptional 8.1% |
| Jordanians | 94.8 /100 | #109 | Exceptional 8.2% |
| Romanians | 94.7 /100 | #110 | Exceptional 8.2% |
| Taiwanese | 94.6 /100 | #111 | Exceptional 8.2% |
| Immigrants | France | 94.4 /100 | #112 | Exceptional 8.2% |
| Canadians | 94.2 /100 | #113 | Exceptional 8.2% |
| Immigrants | Zimbabwe | 94.0 /100 | #114 | Exceptional 8.2% |
| Immigrants | Israel | 93.5 /100 | #115 | Exceptional 8.2% |