Immigrants from Afghanistan vs Basque Family Poverty
COMPARE
Immigrants from Afghanistan
Basque
Family Poverty
Family Poverty Comparison
Immigrants from Afghanistan
Basques
9.2%
FAMILY POVERTY
32.1/ 100
METRIC RATING
189th/ 347
METRIC RANK
8.1%
FAMILY POVERTY
94.9/ 100
METRIC RATING
108th/ 347
METRIC RANK
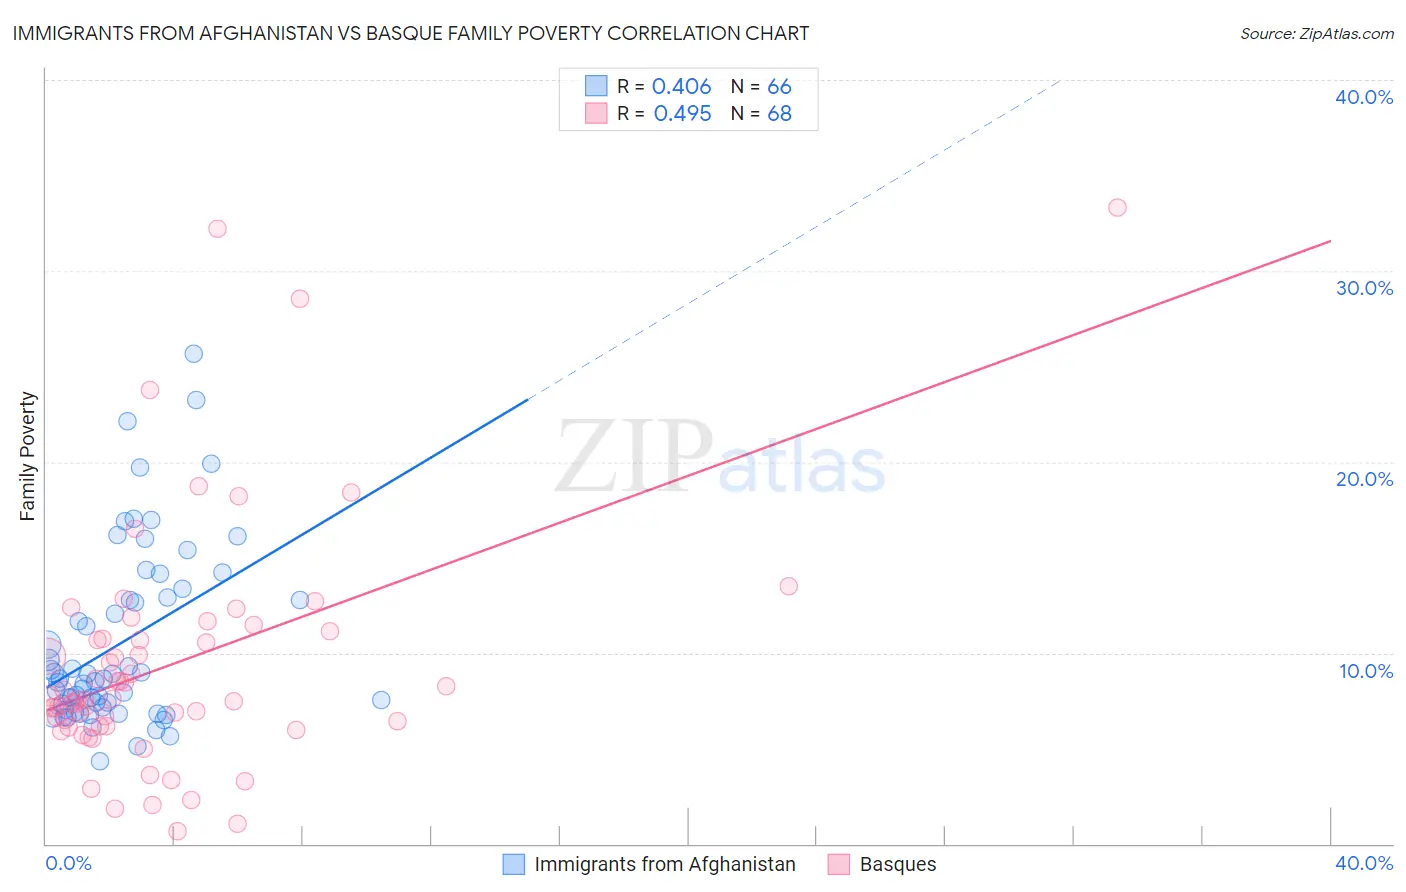
Immigrants from Afghanistan vs Basque Family Poverty Correlation Chart
The statistical analysis conducted on geographies consisting of 147,487,715 people shows a moderate positive correlation between the proportion of Immigrants from Afghanistan and poverty level among families in the United States with a correlation coefficient (R) of 0.406 and weighted average of 9.2%. Similarly, the statistical analysis conducted on geographies consisting of 165,603,932 people shows a moderate positive correlation between the proportion of Basques and poverty level among families in the United States with a correlation coefficient (R) of 0.495 and weighted average of 8.1%, a difference of 13.3%.
Family Poverty Correlation Summary
| Measurement | Immigrants from Afghanistan | Basque |
| Minimum | 4.3% | 0.66% |
| Maximum | 25.6% | 33.3% |
| Range | 21.3% | 32.7% |
| Mean | 10.5% | 9.4% |
| Median | 8.6% | 7.6% |
| Interquartile 25% (IQ1) | 7.2% | 6.2% |
| Interquartile 75% (IQ3) | 12.9% | 10.9% |
| Interquartile Range (IQR) | 5.7% | 4.8% |
| Standard Deviation (Sample) | 4.7% | 6.4% |
| Standard Deviation (Population) | 4.7% | 6.3% |
Similar Demographics by Family Poverty
Demographics Similar to Immigrants from Afghanistan by Family Poverty
In terms of family poverty, the demographic groups most similar to Immigrants from Afghanistan are Arab (9.2%, a difference of 0.090%), Immigrants from Kenya (9.2%, a difference of 0.29%), Delaware (9.2%, a difference of 0.48%), Ugandan (9.3%, a difference of 0.50%), and Spanish (9.3%, a difference of 0.51%).
| Demographics | Rating | Rank | Family Poverty |
| Immigrants | Morocco | 40.2 /100 | #182 | Average 9.1% |
| Uruguayans | 39.2 /100 | #183 | Fair 9.1% |
| South American Indians | 38.7 /100 | #184 | Fair 9.1% |
| Immigrants | Saudi Arabia | 38.6 /100 | #185 | Fair 9.1% |
| Colombians | 36.1 /100 | #186 | Fair 9.2% |
| Delaware | 35.4 /100 | #187 | Fair 9.2% |
| Immigrants | Kenya | 34.0 /100 | #188 | Fair 9.2% |
| Immigrants | Afghanistan | 32.1 /100 | #189 | Fair 9.2% |
| Arabs | 31.5 /100 | #190 | Fair 9.2% |
| Ugandans | 28.7 /100 | #191 | Fair 9.3% |
| Spanish | 28.7 /100 | #192 | Fair 9.3% |
| Immigrants | Western Asia | 28.2 /100 | #193 | Fair 9.3% |
| South Americans | 28.1 /100 | #194 | Fair 9.3% |
| Venezuelans | 27.4 /100 | #195 | Fair 9.3% |
| Immigrants | Venezuela | 26.1 /100 | #196 | Fair 9.3% |
Demographics Similar to Basques by Family Poverty
In terms of family poverty, the demographic groups most similar to Basques are French Canadian (8.1%, a difference of 0.090%), Jordanian (8.2%, a difference of 0.090%), Egyptian (8.1%, a difference of 0.13%), Romanian (8.2%, a difference of 0.18%), and Taiwanese (8.2%, a difference of 0.23%).
| Demographics | Rating | Rank | Family Poverty |
| Immigrants | Norway | 95.7 /100 | #101 | Exceptional 8.1% |
| Immigrants | Indonesia | 95.7 /100 | #102 | Exceptional 8.1% |
| Immigrants | Eastern Europe | 95.6 /100 | #103 | Exceptional 8.1% |
| Slavs | 95.6 /100 | #104 | Exceptional 8.1% |
| Laotians | 95.6 /100 | #105 | Exceptional 8.1% |
| Egyptians | 95.1 /100 | #106 | Exceptional 8.1% |
| French Canadians | 95.0 /100 | #107 | Exceptional 8.1% |
| Basques | 94.9 /100 | #108 | Exceptional 8.1% |
| Jordanians | 94.8 /100 | #109 | Exceptional 8.2% |
| Romanians | 94.7 /100 | #110 | Exceptional 8.2% |
| Taiwanese | 94.6 /100 | #111 | Exceptional 8.2% |
| Immigrants | France | 94.4 /100 | #112 | Exceptional 8.2% |
| Canadians | 94.2 /100 | #113 | Exceptional 8.2% |
| Immigrants | Zimbabwe | 94.0 /100 | #114 | Exceptional 8.2% |
| Immigrants | Israel | 93.5 /100 | #115 | Exceptional 8.2% |