Immigrants from Argentina vs Basque Family Poverty
COMPARE
Immigrants from Argentina
Basque
Family Poverty
Family Poverty Comparison
Immigrants from Argentina
Basques
8.4%
FAMILY POVERTY
88.2/ 100
METRIC RATING
132nd/ 347
METRIC RANK
8.1%
FAMILY POVERTY
94.9/ 100
METRIC RATING
108th/ 347
METRIC RANK
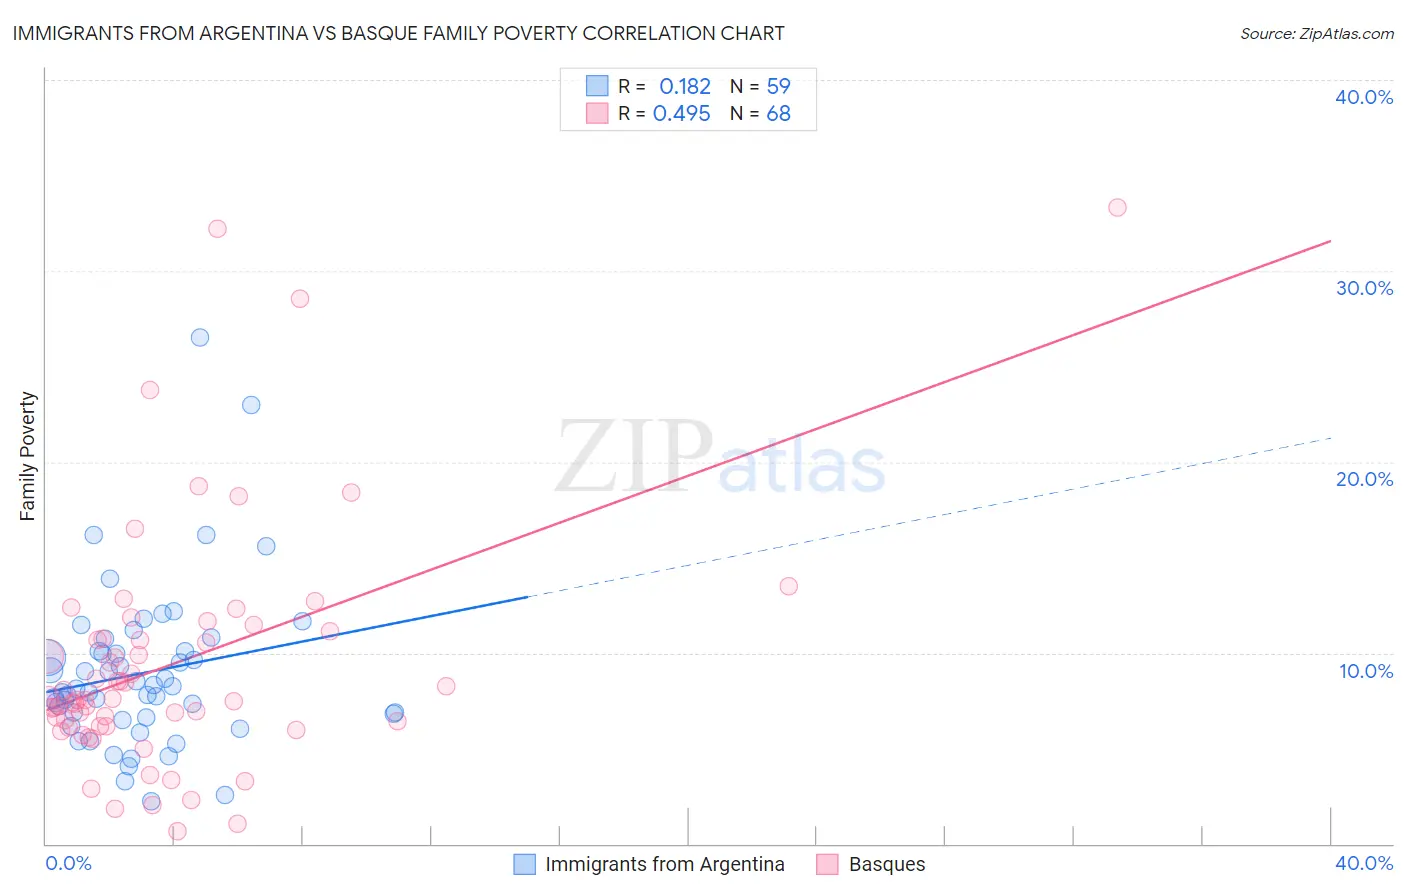
Immigrants from Argentina vs Basque Family Poverty Correlation Chart
The statistical analysis conducted on geographies consisting of 264,069,938 people shows a poor positive correlation between the proportion of Immigrants from Argentina and poverty level among families in the United States with a correlation coefficient (R) of 0.182 and weighted average of 8.4%. Similarly, the statistical analysis conducted on geographies consisting of 165,603,932 people shows a moderate positive correlation between the proportion of Basques and poverty level among families in the United States with a correlation coefficient (R) of 0.495 and weighted average of 8.1%, a difference of 3.3%.
Family Poverty Correlation Summary
| Measurement | Immigrants from Argentina | Basque |
| Minimum | 2.3% | 0.66% |
| Maximum | 26.5% | 33.3% |
| Range | 24.3% | 32.7% |
| Mean | 8.9% | 9.4% |
| Median | 8.1% | 7.6% |
| Interquartile 25% (IQ1) | 6.6% | 6.2% |
| Interquartile 75% (IQ3) | 10.1% | 10.9% |
| Interquartile Range (IQR) | 3.5% | 4.8% |
| Standard Deviation (Sample) | 4.3% | 6.4% |
| Standard Deviation (Population) | 4.2% | 6.3% |
Similar Demographics by Family Poverty
Demographics Similar to Immigrants from Argentina by Family Poverty
In terms of family poverty, the demographic groups most similar to Immigrants from Argentina are Puget Sound Salish (8.4%, a difference of 0.15%), Immigrants from Bosnia and Herzegovina (8.4%, a difference of 0.16%), Portuguese (8.4%, a difference of 0.34%), Argentinean (8.4%, a difference of 0.49%), and Sri Lankan (8.5%, a difference of 0.50%).
| Demographics | Rating | Rank | Family Poverty |
| Pakistanis | 90.8 /100 | #125 | Exceptional 8.3% |
| Icelanders | 90.3 /100 | #126 | Exceptional 8.3% |
| Immigrants | Hungary | 89.9 /100 | #127 | Excellent 8.4% |
| Argentineans | 89.6 /100 | #128 | Excellent 8.4% |
| Portuguese | 89.2 /100 | #129 | Excellent 8.4% |
| Immigrants | Bosnia and Herzegovina | 88.6 /100 | #130 | Excellent 8.4% |
| Puget Sound Salish | 88.6 /100 | #131 | Excellent 8.4% |
| Immigrants | Argentina | 88.2 /100 | #132 | Excellent 8.4% |
| Sri Lankans | 86.6 /100 | #133 | Excellent 8.5% |
| Chileans | 86.6 /100 | #134 | Excellent 8.5% |
| Immigrants | Malaysia | 86.5 /100 | #135 | Excellent 8.5% |
| Immigrants | Brazil | 86.3 /100 | #136 | Excellent 8.5% |
| Immigrants | Southern Europe | 86.0 /100 | #137 | Excellent 8.5% |
| Armenians | 84.6 /100 | #138 | Excellent 8.5% |
| Immigrants | Nepal | 84.2 /100 | #139 | Excellent 8.5% |
Demographics Similar to Basques by Family Poverty
In terms of family poverty, the demographic groups most similar to Basques are French Canadian (8.1%, a difference of 0.090%), Jordanian (8.2%, a difference of 0.090%), Egyptian (8.1%, a difference of 0.13%), Romanian (8.2%, a difference of 0.18%), and Taiwanese (8.2%, a difference of 0.23%).
| Demographics | Rating | Rank | Family Poverty |
| Immigrants | Norway | 95.7 /100 | #101 | Exceptional 8.1% |
| Immigrants | Indonesia | 95.7 /100 | #102 | Exceptional 8.1% |
| Immigrants | Eastern Europe | 95.6 /100 | #103 | Exceptional 8.1% |
| Slavs | 95.6 /100 | #104 | Exceptional 8.1% |
| Laotians | 95.6 /100 | #105 | Exceptional 8.1% |
| Egyptians | 95.1 /100 | #106 | Exceptional 8.1% |
| French Canadians | 95.0 /100 | #107 | Exceptional 8.1% |
| Basques | 94.9 /100 | #108 | Exceptional 8.1% |
| Jordanians | 94.8 /100 | #109 | Exceptional 8.2% |
| Romanians | 94.7 /100 | #110 | Exceptional 8.2% |
| Taiwanese | 94.6 /100 | #111 | Exceptional 8.2% |
| Immigrants | France | 94.4 /100 | #112 | Exceptional 8.2% |
| Canadians | 94.2 /100 | #113 | Exceptional 8.2% |
| Immigrants | Zimbabwe | 94.0 /100 | #114 | Exceptional 8.2% |
| Immigrants | Israel | 93.5 /100 | #115 | Exceptional 8.2% |