Carpatho Rusyn vs Immigrants from El Salvador Child Poverty Among Girls Under 16
COMPARE
Carpatho Rusyn
Immigrants from El Salvador
Child Poverty Among Girls Under 16
Child Poverty Among Girls Under 16 Comparison
Carpatho Rusyns
Immigrants from El Salvador
15.3%
CHILD POVERTY AMONG GIRLS UNDER 16
91.4/ 100
METRIC RATING
124th/ 347
METRIC RANK
20.0%
CHILD POVERTY AMONG GIRLS UNDER 16
0.1/ 100
METRIC RATING
272nd/ 347
METRIC RANK
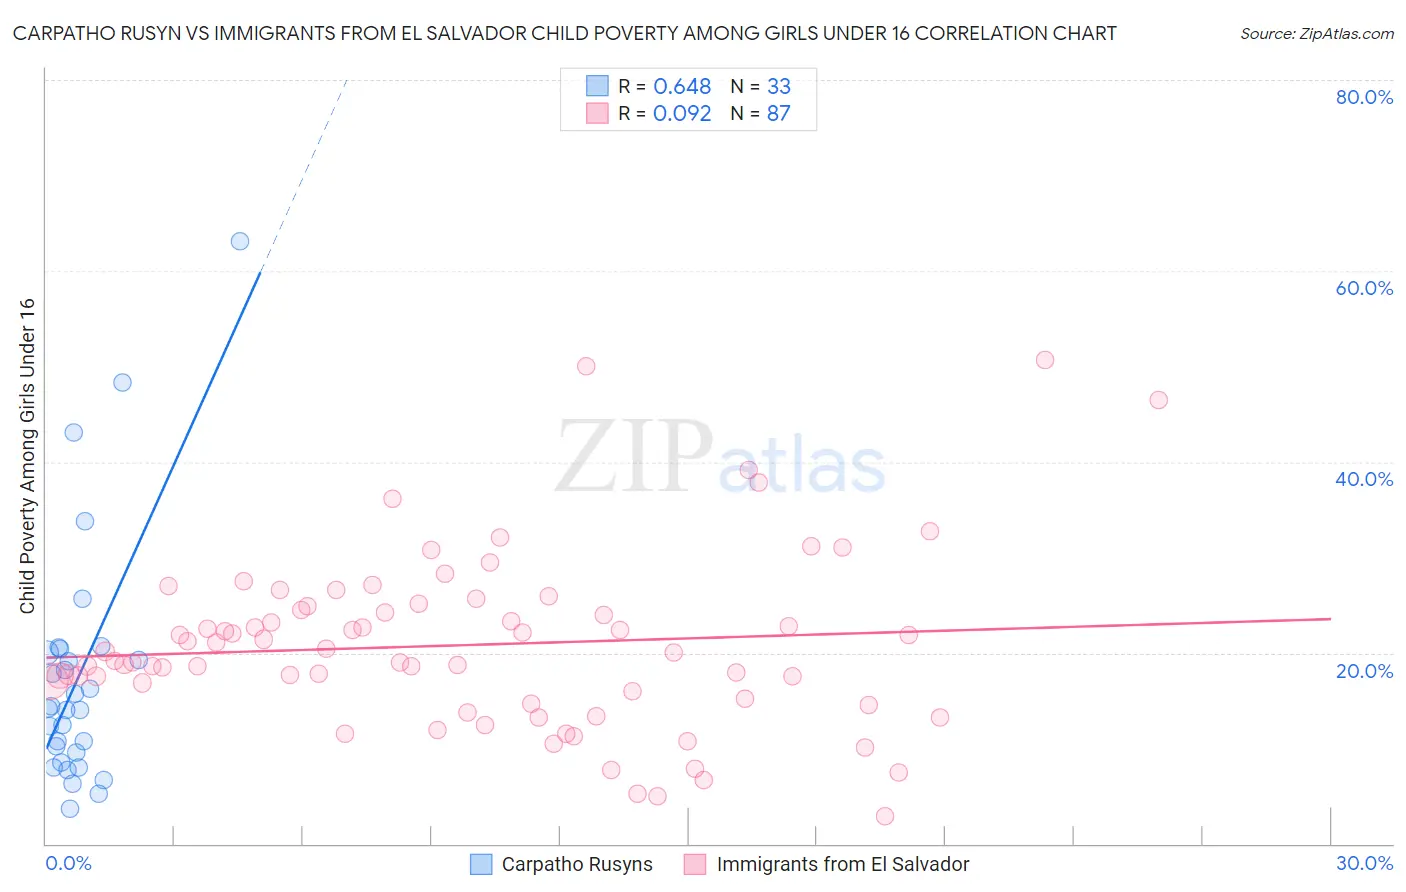
Carpatho Rusyn vs Immigrants from El Salvador Child Poverty Among Girls Under 16 Correlation Chart
The statistical analysis conducted on geographies consisting of 58,411,272 people shows a significant positive correlation between the proportion of Carpatho Rusyns and poverty level among girls under the age of 16 in the United States with a correlation coefficient (R) of 0.648 and weighted average of 15.3%. Similarly, the statistical analysis conducted on geographies consisting of 353,816,537 people shows a slight positive correlation between the proportion of Immigrants from El Salvador and poverty level among girls under the age of 16 in the United States with a correlation coefficient (R) of 0.092 and weighted average of 20.0%, a difference of 30.0%.
Child Poverty Among Girls Under 16 Correlation Summary
| Measurement | Carpatho Rusyn | Immigrants from El Salvador |
| Minimum | 3.6% | 2.8% |
| Maximum | 63.2% | 50.7% |
| Range | 59.5% | 47.8% |
| Mean | 17.5% | 20.8% |
| Median | 14.2% | 20.0% |
| Interquartile 25% (IQ1) | 9.1% | 15.2% |
| Interquartile 75% (IQ3) | 20.2% | 24.9% |
| Interquartile Range (IQR) | 11.2% | 9.8% |
| Standard Deviation (Sample) | 12.9% | 9.1% |
| Standard Deviation (Population) | 12.7% | 9.0% |
Similar Demographics by Child Poverty Among Girls Under 16
Demographics Similar to Carpatho Rusyns by Child Poverty Among Girls Under 16
In terms of child poverty among girls under 16, the demographic groups most similar to Carpatho Rusyns are Irish (15.3%, a difference of 0.050%), Peruvian (15.4%, a difference of 0.11%), Portuguese (15.3%, a difference of 0.14%), Scottish (15.4%, a difference of 0.17%), and Immigrants from Norway (15.4%, a difference of 0.24%).
| Demographics | Rating | Rank | Child Poverty Among Girls Under 16 |
| Immigrants | North Macedonia | 93.1 /100 | #117 | Exceptional 15.2% |
| Immigrants | Southern Europe | 92.7 /100 | #118 | Exceptional 15.3% |
| Immigrants | Zimbabwe | 92.5 /100 | #119 | Exceptional 15.3% |
| Pakistanis | 92.3 /100 | #120 | Exceptional 15.3% |
| English | 92.2 /100 | #121 | Exceptional 15.3% |
| Portuguese | 91.8 /100 | #122 | Exceptional 15.3% |
| Irish | 91.5 /100 | #123 | Exceptional 15.3% |
| Carpatho Rusyns | 91.4 /100 | #124 | Exceptional 15.3% |
| Peruvians | 91.2 /100 | #125 | Exceptional 15.4% |
| Scottish | 91.0 /100 | #126 | Exceptional 15.4% |
| Immigrants | Norway | 90.8 /100 | #127 | Exceptional 15.4% |
| Albanians | 90.5 /100 | #128 | Exceptional 15.4% |
| Immigrants | South Eastern Asia | 90.5 /100 | #129 | Exceptional 15.4% |
| Puget Sound Salish | 90.1 /100 | #130 | Exceptional 15.4% |
| Immigrants | Western Europe | 90.0 /100 | #131 | Exceptional 15.4% |
Demographics Similar to Immigrants from El Salvador by Child Poverty Among Girls Under 16
In terms of child poverty among girls under 16, the demographic groups most similar to Immigrants from El Salvador are Immigrants from Barbados (19.9%, a difference of 0.11%), Bangladeshi (20.0%, a difference of 0.20%), Cherokee (19.9%, a difference of 0.21%), Liberian (19.9%, a difference of 0.40%), and Spanish American Indian (19.9%, a difference of 0.50%).
| Demographics | Rating | Rank | Child Poverty Among Girls Under 16 |
| Immigrants | Jamaica | 0.1 /100 | #265 | Tragic 19.8% |
| Spanish Americans | 0.1 /100 | #266 | Tragic 19.8% |
| Immigrants | Bangladesh | 0.1 /100 | #267 | Tragic 19.9% |
| Spanish American Indians | 0.1 /100 | #268 | Tragic 19.9% |
| Liberians | 0.1 /100 | #269 | Tragic 19.9% |
| Cherokee | 0.1 /100 | #270 | Tragic 19.9% |
| Immigrants | Barbados | 0.1 /100 | #271 | Tragic 19.9% |
| Immigrants | El Salvador | 0.1 /100 | #272 | Tragic 20.0% |
| Bangladeshis | 0.1 /100 | #273 | Tragic 20.0% |
| Immigrants | St. Vincent and the Grenadines | 0.0 /100 | #274 | Tragic 20.1% |
| Sub-Saharan Africans | 0.0 /100 | #275 | Tragic 20.1% |
| Comanche | 0.0 /100 | #276 | Tragic 20.2% |
| Belizeans | 0.0 /100 | #277 | Tragic 20.2% |
| Barbadians | 0.0 /100 | #278 | Tragic 20.2% |
| Immigrants | Zaire | 0.0 /100 | #279 | Tragic 20.2% |