Carpatho Rusyn vs Immigrants from Central America Female Poverty
COMPARE
Carpatho Rusyn
Immigrants from Central America
Female Poverty
Female Poverty Comparison
Carpatho Rusyns
Immigrants from Central America
12.2%
FEMALE POVERTY
97.6/ 100
METRIC RATING
71st/ 347
METRIC RANK
16.8%
FEMALE POVERTY
0.0/ 100
METRIC RATING
304th/ 347
METRIC RANK
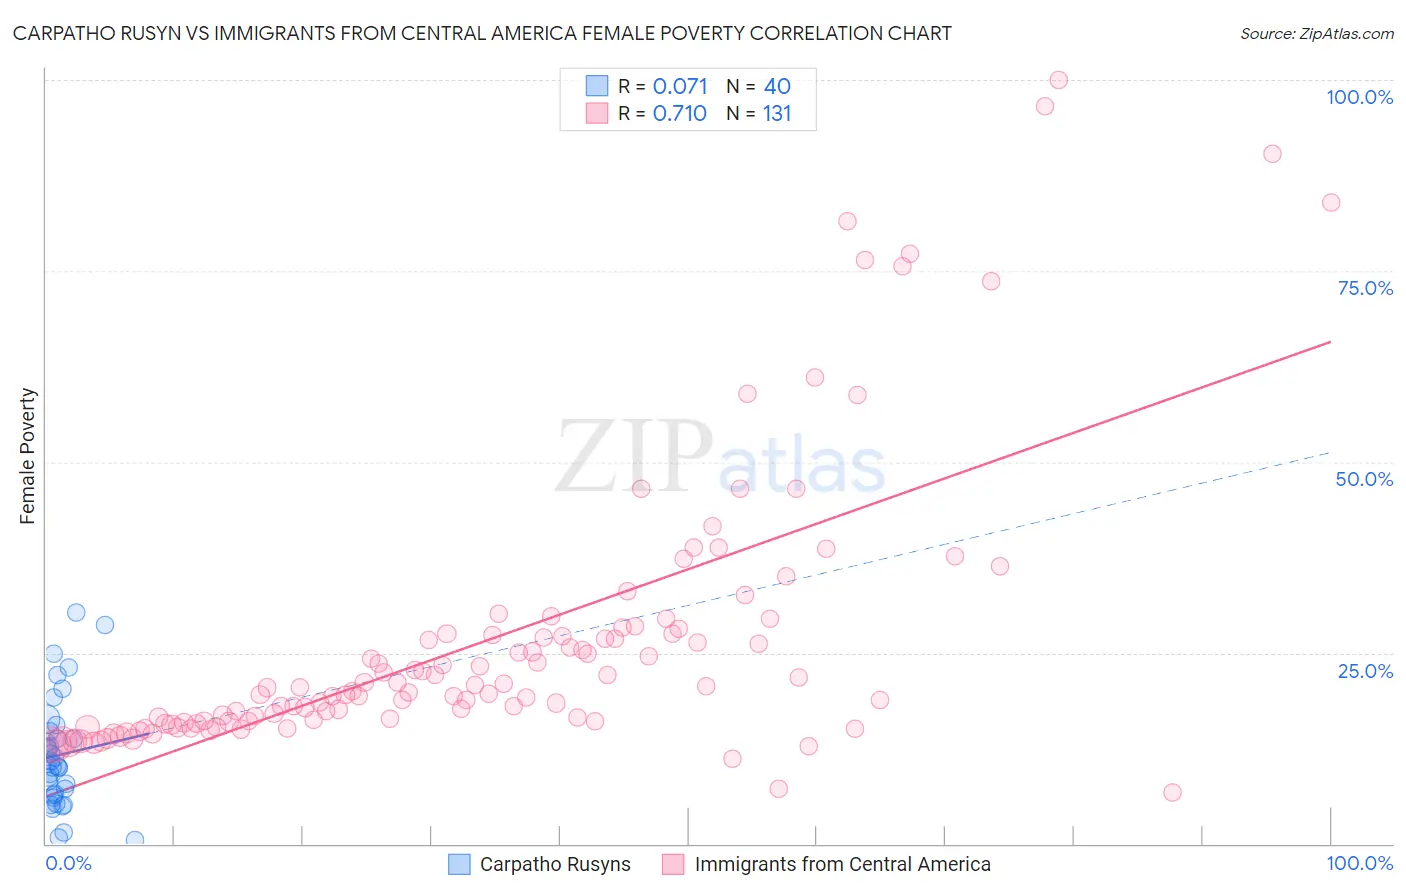
Carpatho Rusyn vs Immigrants from Central America Female Poverty Correlation Chart
The statistical analysis conducted on geographies consisting of 58,861,278 people shows a slight positive correlation between the proportion of Carpatho Rusyns and poverty level among females in the United States with a correlation coefficient (R) of 0.071 and weighted average of 12.2%. Similarly, the statistical analysis conducted on geographies consisting of 535,791,715 people shows a strong positive correlation between the proportion of Immigrants from Central America and poverty level among females in the United States with a correlation coefficient (R) of 0.710 and weighted average of 16.8%, a difference of 37.3%.
Female Poverty Correlation Summary
| Measurement | Carpatho Rusyn | Immigrants from Central America |
| Minimum | 0.50% | 6.7% |
| Maximum | 30.2% | 100.0% |
| Range | 29.7% | 93.3% |
| Mean | 11.6% | 26.7% |
| Median | 10.3% | 20.4% |
| Interquartile 25% (IQ1) | 6.5% | 16.0% |
| Interquartile 75% (IQ3) | 14.3% | 27.6% |
| Interquartile Range (IQR) | 7.8% | 11.5% |
| Standard Deviation (Sample) | 7.1% | 18.5% |
| Standard Deviation (Population) | 7.0% | 18.4% |
Similar Demographics by Female Poverty
Demographics Similar to Carpatho Rusyns by Female Poverty
In terms of female poverty, the demographic groups most similar to Carpatho Rusyns are Cambodian (12.2%, a difference of 0.030%), Zimbabwean (12.3%, a difference of 0.050%), Immigrants from Canada (12.3%, a difference of 0.060%), Immigrants from Belgium (12.2%, a difference of 0.13%), and Swiss (12.2%, a difference of 0.15%).
| Demographics | Rating | Rank | Female Poverty |
| Germans | 98.0 /100 | #64 | Exceptional 12.2% |
| Indians (Asian) | 97.9 /100 | #65 | Exceptional 12.2% |
| Austrians | 97.9 /100 | #66 | Exceptional 12.2% |
| Immigrants | Eastern Asia | 97.8 /100 | #67 | Exceptional 12.2% |
| Immigrants | Netherlands | 97.8 /100 | #68 | Exceptional 12.2% |
| Swiss | 97.7 /100 | #69 | Exceptional 12.2% |
| Immigrants | Belgium | 97.7 /100 | #70 | Exceptional 12.2% |
| Carpatho Rusyns | 97.6 /100 | #71 | Exceptional 12.2% |
| Cambodians | 97.5 /100 | #72 | Exceptional 12.2% |
| Zimbabweans | 97.5 /100 | #73 | Exceptional 12.3% |
| Immigrants | Canada | 97.5 /100 | #74 | Exceptional 12.3% |
| Europeans | 97.4 /100 | #75 | Exceptional 12.3% |
| Immigrants | Eastern Europe | 97.2 /100 | #76 | Exceptional 12.3% |
| Serbians | 97.2 /100 | #77 | Exceptional 12.3% |
| Egyptians | 97.2 /100 | #78 | Exceptional 12.3% |
Demographics Similar to Immigrants from Central America by Female Poverty
In terms of female poverty, the demographic groups most similar to Immigrants from Central America are Immigrants from Grenada (16.8%, a difference of 0.0%), Choctaw (16.8%, a difference of 0.060%), Immigrants from Caribbean (16.9%, a difference of 0.27%), Seminole (16.9%, a difference of 0.40%), and African (16.9%, a difference of 0.46%).
| Demographics | Rating | Rank | Female Poverty |
| Mexicans | 0.0 /100 | #297 | Tragic 16.5% |
| Somalis | 0.0 /100 | #298 | Tragic 16.6% |
| Hispanics or Latinos | 0.0 /100 | #299 | Tragic 16.6% |
| Bahamians | 0.0 /100 | #300 | Tragic 16.6% |
| Guatemalans | 0.0 /100 | #301 | Tragic 16.7% |
| Chippewa | 0.0 /100 | #302 | Tragic 16.7% |
| Choctaw | 0.0 /100 | #303 | Tragic 16.8% |
| Immigrants | Central America | 0.0 /100 | #304 | Tragic 16.8% |
| Immigrants | Grenada | 0.0 /100 | #305 | Tragic 16.8% |
| Immigrants | Caribbean | 0.0 /100 | #306 | Tragic 16.9% |
| Seminole | 0.0 /100 | #307 | Tragic 16.9% |
| Africans | 0.0 /100 | #308 | Tragic 16.9% |
| Immigrants | Mexico | 0.0 /100 | #309 | Tragic 17.0% |
| Creek | 0.0 /100 | #310 | Tragic 17.0% |
| Immigrants | Guatemala | 0.0 /100 | #311 | Tragic 17.0% |