Pakistani vs Immigrants from Ethiopia Female Poverty
COMPARE
Pakistani
Immigrants from Ethiopia
Female Poverty
Female Poverty Comparison
Pakistanis
Immigrants from Ethiopia
12.9%
FEMALE POVERTY
83.0/ 100
METRIC RATING
140th/ 347
METRIC RANK
13.3%
FEMALE POVERTY
62.5/ 100
METRIC RATING
161st/ 347
METRIC RANK
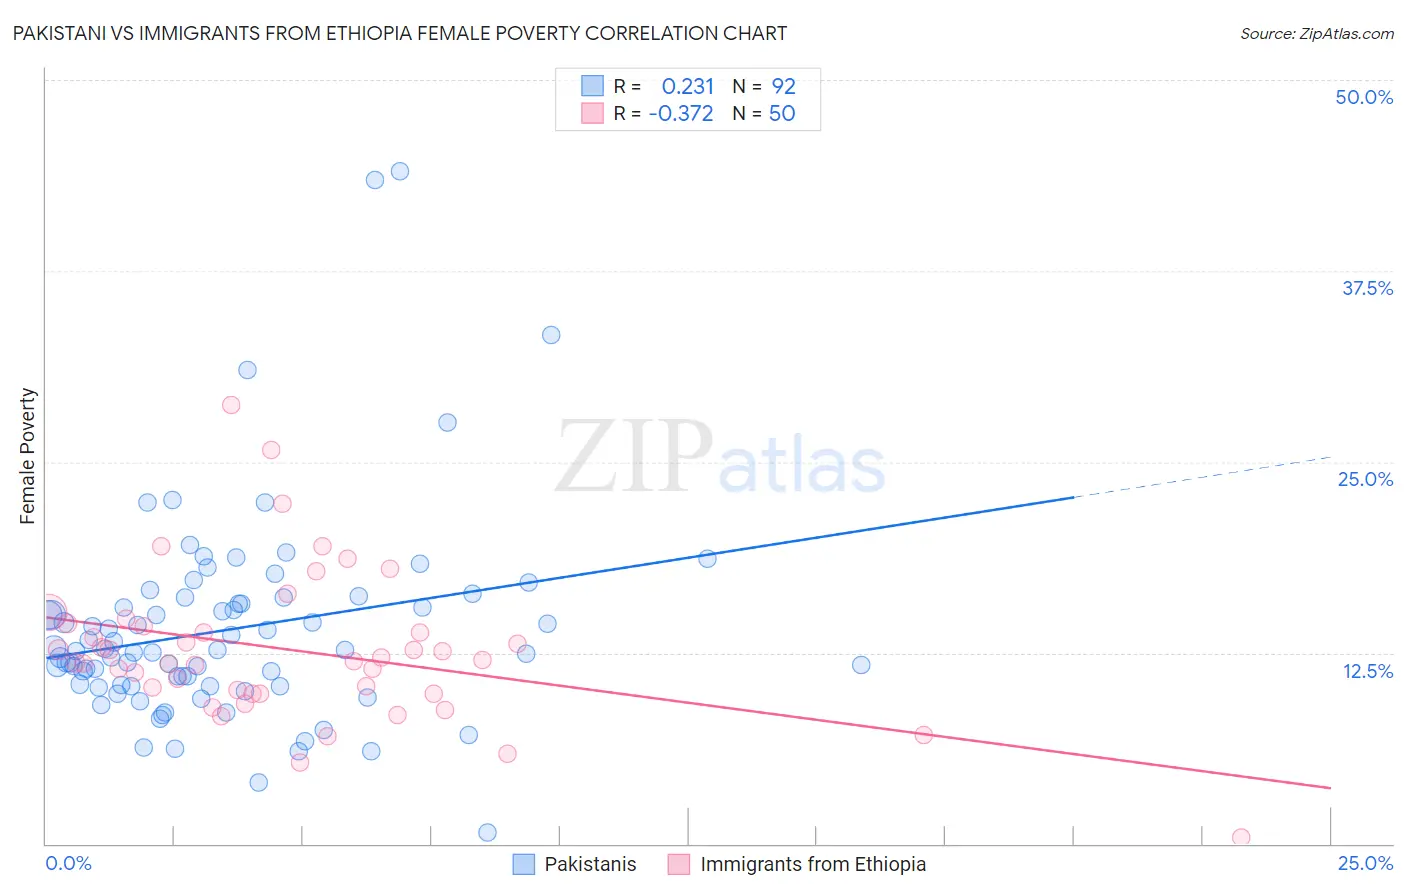
Pakistani vs Immigrants from Ethiopia Female Poverty Correlation Chart
The statistical analysis conducted on geographies consisting of 335,177,271 people shows a weak positive correlation between the proportion of Pakistanis and poverty level among females in the United States with a correlation coefficient (R) of 0.231 and weighted average of 12.9%. Similarly, the statistical analysis conducted on geographies consisting of 211,427,583 people shows a mild negative correlation between the proportion of Immigrants from Ethiopia and poverty level among females in the United States with a correlation coefficient (R) of -0.372 and weighted average of 13.3%, a difference of 2.7%.
Female Poverty Correlation Summary
| Measurement | Pakistani | Immigrants from Ethiopia |
| Minimum | 0.74% | 0.38% |
| Maximum | 44.1% | 28.7% |
| Range | 43.3% | 28.3% |
| Mean | 14.0% | 12.7% |
| Median | 12.7% | 12.0% |
| Interquartile 25% (IQ1) | 10.3% | 9.9% |
| Interquartile 75% (IQ3) | 15.9% | 14.2% |
| Interquartile Range (IQR) | 5.6% | 4.4% |
| Standard Deviation (Sample) | 6.8% | 4.9% |
| Standard Deviation (Population) | 6.7% | 4.9% |
Similar Demographics by Female Poverty
Demographics Similar to Pakistanis by Female Poverty
In terms of female poverty, the demographic groups most similar to Pakistanis are Basque (12.9%, a difference of 0.010%), Immigrants from France (12.9%, a difference of 0.10%), Chilean (12.9%, a difference of 0.32%), Icelander (13.0%, a difference of 0.32%), and Peruvian (12.9%, a difference of 0.41%).
| Demographics | Rating | Rank | Female Poverty |
| Immigrants | Western Europe | 86.6 /100 | #133 | Excellent 12.8% |
| Immigrants | Switzerland | 85.8 /100 | #134 | Excellent 12.9% |
| French | 85.6 /100 | #135 | Excellent 12.9% |
| Peruvians | 85.2 /100 | #136 | Excellent 12.9% |
| Chileans | 84.7 /100 | #137 | Excellent 12.9% |
| Immigrants | France | 83.6 /100 | #138 | Excellent 12.9% |
| Basques | 83.1 /100 | #139 | Excellent 12.9% |
| Pakistanis | 83.0 /100 | #140 | Excellent 12.9% |
| Icelanders | 81.1 /100 | #141 | Excellent 13.0% |
| Brazilians | 80.5 /100 | #142 | Excellent 13.0% |
| Immigrants | Malaysia | 80.4 /100 | #143 | Excellent 13.0% |
| Afghans | 79.8 /100 | #144 | Good 13.0% |
| Syrians | 79.6 /100 | #145 | Good 13.0% |
| Immigrants | Peru | 79.1 /100 | #146 | Good 13.0% |
| Immigrants | Kazakhstan | 78.6 /100 | #147 | Good 13.0% |
Demographics Similar to Immigrants from Ethiopia by Female Poverty
In terms of female poverty, the demographic groups most similar to Immigrants from Ethiopia are Guamanian/Chamorro (13.3%, a difference of 0.010%), Immigrants from Albania (13.3%, a difference of 0.010%), Ethiopian (13.3%, a difference of 0.020%), Immigrants from Nepal (13.3%, a difference of 0.030%), and Scotch-Irish (13.3%, a difference of 0.040%).
| Demographics | Rating | Rank | Female Poverty |
| Armenians | 70.4 /100 | #154 | Good 13.2% |
| Hungarians | 70.1 /100 | #155 | Good 13.2% |
| Immigrants | Bosnia and Herzegovina | 69.7 /100 | #156 | Good 13.2% |
| Immigrants | Northern Africa | 68.8 /100 | #157 | Good 13.2% |
| Pennsylvania Germans | 67.3 /100 | #158 | Good 13.2% |
| Costa Ricans | 63.6 /100 | #159 | Good 13.3% |
| Immigrants | Nepal | 62.7 /100 | #160 | Good 13.3% |
| Immigrants | Ethiopia | 62.5 /100 | #161 | Good 13.3% |
| Guamanians/Chamorros | 62.4 /100 | #162 | Good 13.3% |
| Immigrants | Albania | 62.4 /100 | #163 | Good 13.3% |
| Ethiopians | 62.3 /100 | #164 | Good 13.3% |
| Scotch-Irish | 62.1 /100 | #165 | Good 13.3% |
| Immigrants | Oceania | 59.7 /100 | #166 | Average 13.3% |
| Immigrants | Chile | 57.4 /100 | #167 | Average 13.3% |
| Aleuts | 56.7 /100 | #168 | Average 13.4% |