Cape Verdean vs Immigrants from Ethiopia In Labor Force | Age 45-54
COMPARE
Cape Verdean
Immigrants from Ethiopia
In Labor Force | Age 45-54
In Labor Force | Age 45-54 Comparison
Cape Verdeans
Immigrants from Ethiopia
82.1%
IN LABOR FORCE | AGE 45-54
2.1/ 100
METRIC RATING
228th/ 347
METRIC RANK
84.8%
IN LABOR FORCE | AGE 45-54
100.0/ 100
METRIC RATING
4th/ 347
METRIC RANK
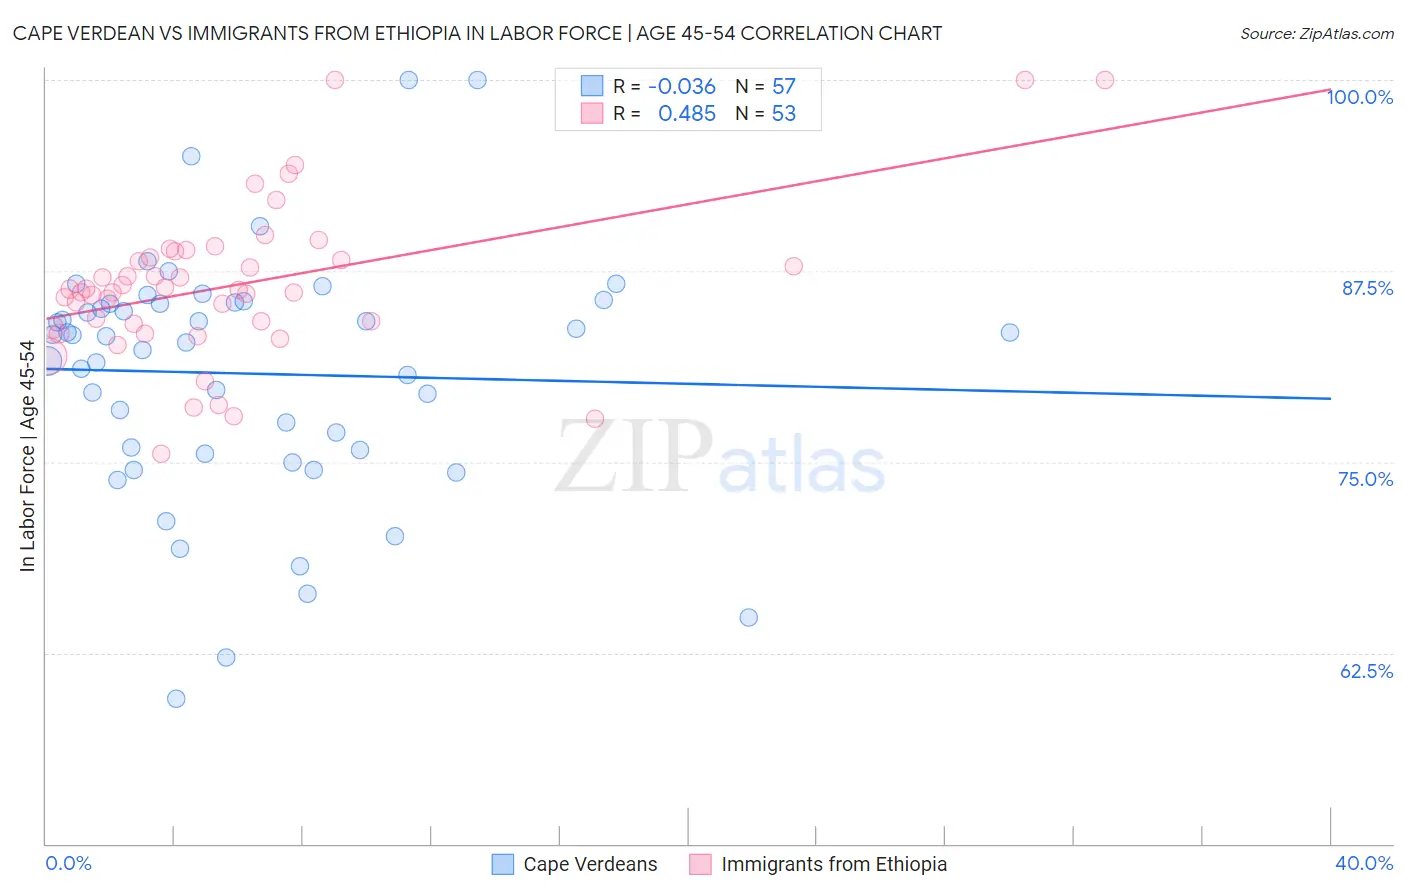
Cape Verdean vs Immigrants from Ethiopia In Labor Force | Age 45-54 Correlation Chart
The statistical analysis conducted on geographies consisting of 107,547,250 people shows no correlation between the proportion of Cape Verdeans and labor force participation rate among population between the ages 45 and 54 in the United States with a correlation coefficient (R) of -0.036 and weighted average of 82.1%. Similarly, the statistical analysis conducted on geographies consisting of 211,453,316 people shows a moderate positive correlation between the proportion of Immigrants from Ethiopia and labor force participation rate among population between the ages 45 and 54 in the United States with a correlation coefficient (R) of 0.485 and weighted average of 84.8%, a difference of 3.4%.
In Labor Force | Age 45-54 Correlation Summary
| Measurement | Cape Verdean | Immigrants from Ethiopia |
| Minimum | 59.5% | 75.6% |
| Maximum | 100.0% | 100.0% |
| Range | 40.5% | 24.4% |
| Mean | 80.8% | 86.6% |
| Median | 83.2% | 86.2% |
| Interquartile 25% (IQ1) | 75.7% | 83.9% |
| Interquartile 75% (IQ3) | 85.4% | 88.6% |
| Interquartile Range (IQR) | 9.7% | 4.7% |
| Standard Deviation (Sample) | 8.0% | 5.1% |
| Standard Deviation (Population) | 8.0% | 5.0% |
Similar Demographics by In Labor Force | Age 45-54
Demographics Similar to Cape Verdeans by In Labor Force | Age 45-54
In terms of in labor force | age 45-54, the demographic groups most similar to Cape Verdeans are Immigrants from Burma/Myanmar (82.0%, a difference of 0.020%), Immigrants from Germany (82.1%, a difference of 0.030%), Immigrants from Oceania (82.1%, a difference of 0.040%), Immigrants from Caribbean (82.1%, a difference of 0.040%), and Jamaican (82.0%, a difference of 0.040%).
| Demographics | Rating | Rank | In Labor Force | Age 45-54 |
| Panamanians | 3.5 /100 | #221 | Tragic 82.2% |
| Immigrants | Ecuador | 3.4 /100 | #222 | Tragic 82.2% |
| Immigrants | Immigrants | 3.1 /100 | #223 | Tragic 82.1% |
| Immigrants | Jamaica | 2.7 /100 | #224 | Tragic 82.1% |
| Immigrants | Oceania | 2.5 /100 | #225 | Tragic 82.1% |
| Immigrants | Caribbean | 2.5 /100 | #226 | Tragic 82.1% |
| Immigrants | Germany | 2.4 /100 | #227 | Tragic 82.1% |
| Cape Verdeans | 2.1 /100 | #228 | Tragic 82.1% |
| Immigrants | Burma/Myanmar | 1.9 /100 | #229 | Tragic 82.0% |
| Jamaicans | 1.8 /100 | #230 | Tragic 82.0% |
| Immigrants | Senegal | 1.7 /100 | #231 | Tragic 82.0% |
| Immigrants | Portugal | 1.7 /100 | #232 | Tragic 82.0% |
| Malaysians | 1.7 /100 | #233 | Tragic 82.0% |
| Salvadorans | 1.7 /100 | #234 | Tragic 82.0% |
| Sub-Saharan Africans | 1.2 /100 | #235 | Tragic 82.0% |
Demographics Similar to Immigrants from Ethiopia by In Labor Force | Age 45-54
In terms of in labor force | age 45-54, the demographic groups most similar to Immigrants from Ethiopia are Ethiopian (84.8%, a difference of 0.080%), Bolivian (84.9%, a difference of 0.12%), Immigrants from India (84.7%, a difference of 0.19%), Luxembourger (85.0%, a difference of 0.21%), and Immigrants from Cameroon (84.6%, a difference of 0.25%).
| Demographics | Rating | Rank | In Labor Force | Age 45-54 |
| Immigrants | Bolivia | 100.0 /100 | #1 | Exceptional 85.3% |
| Luxembourgers | 100.0 /100 | #2 | Exceptional 85.0% |
| Bolivians | 100.0 /100 | #3 | Exceptional 84.9% |
| Immigrants | Ethiopia | 100.0 /100 | #4 | Exceptional 84.8% |
| Ethiopians | 100.0 /100 | #5 | Exceptional 84.8% |
| Immigrants | India | 100.0 /100 | #6 | Exceptional 84.7% |
| Immigrants | Cameroon | 100.0 /100 | #7 | Exceptional 84.6% |
| Sierra Leoneans | 100.0 /100 | #8 | Exceptional 84.5% |
| Immigrants | Sierra Leone | 100.0 /100 | #9 | Exceptional 84.4% |
| Norwegians | 100.0 /100 | #10 | Exceptional 84.4% |
| Thais | 100.0 /100 | #11 | Exceptional 84.3% |
| Bulgarians | 100.0 /100 | #12 | Exceptional 84.2% |
| Chinese | 99.9 /100 | #13 | Exceptional 84.1% |
| Cambodians | 99.9 /100 | #14 | Exceptional 84.1% |
| Cypriots | 99.9 /100 | #15 | Exceptional 84.1% |