Brazilian vs Cypriot Male Poverty
COMPARE
Brazilian
Cypriot
Male Poverty
Male Poverty Comparison
Brazilians
Cypriots
10.8%
MALE POVERTY
82.7/ 100
METRIC RATING
135th/ 347
METRIC RANK
9.9%
MALE POVERTY
99.2/ 100
METRIC RATING
40th/ 347
METRIC RANK
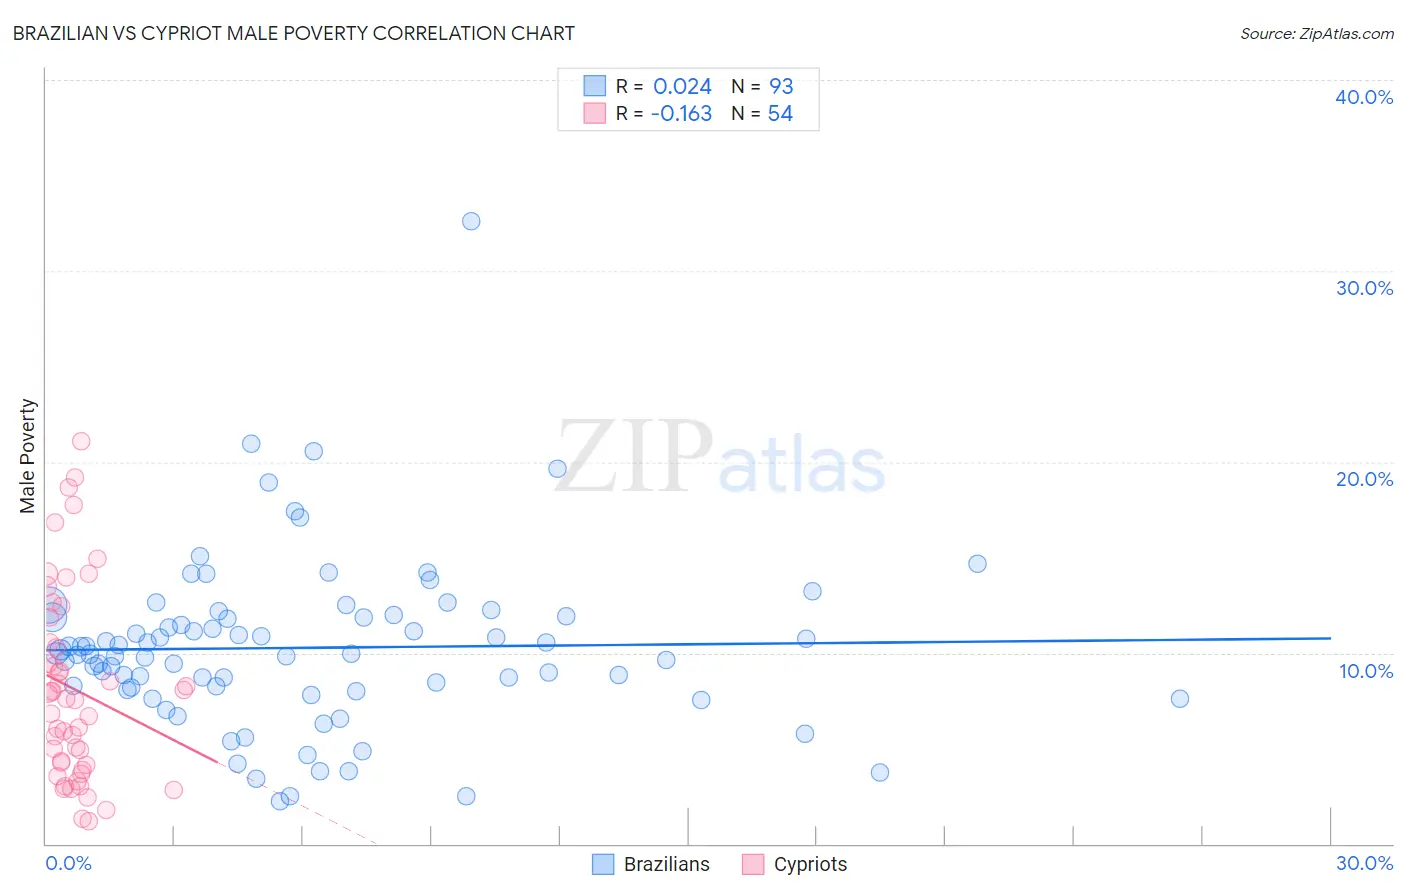
Brazilian vs Cypriot Male Poverty Correlation Chart
The statistical analysis conducted on geographies consisting of 323,645,938 people shows no correlation between the proportion of Brazilians and poverty level among males in the United States with a correlation coefficient (R) of 0.024 and weighted average of 10.8%. Similarly, the statistical analysis conducted on geographies consisting of 61,836,468 people shows a poor negative correlation between the proportion of Cypriots and poverty level among males in the United States with a correlation coefficient (R) of -0.163 and weighted average of 9.9%, a difference of 9.1%.
Male Poverty Correlation Summary
| Measurement | Brazilian | Cypriot |
| Minimum | 2.2% | 1.2% |
| Maximum | 32.6% | 21.1% |
| Range | 30.4% | 19.9% |
| Mean | 10.3% | 8.1% |
| Median | 10.0% | 7.6% |
| Interquartile 25% (IQ1) | 8.1% | 4.1% |
| Interquartile 75% (IQ3) | 11.9% | 10.5% |
| Interquartile Range (IQR) | 3.8% | 6.4% |
| Standard Deviation (Sample) | 4.4% | 5.0% |
| Standard Deviation (Population) | 4.4% | 4.9% |
Similar Demographics by Male Poverty
Demographics Similar to Brazilians by Male Poverty
In terms of male poverty, the demographic groups most similar to Brazilians are New Zealander (10.8%, a difference of 0.040%), Pakistani (10.8%, a difference of 0.050%), Immigrants from Vietnam (10.8%, a difference of 0.060%), Immigrants from Belarus (10.7%, a difference of 0.11%), and Chilean (10.7%, a difference of 0.22%).
| Demographics | Rating | Rank | Male Poverty |
| Immigrants | Western Europe | 84.2 /100 | #128 | Excellent 10.7% |
| Immigrants | Peru | 84.1 /100 | #129 | Excellent 10.7% |
| Chileans | 83.9 /100 | #130 | Excellent 10.7% |
| Immigrants | Belarus | 83.3 /100 | #131 | Excellent 10.7% |
| Immigrants | Vietnam | 83.0 /100 | #132 | Excellent 10.8% |
| Pakistanis | 83.0 /100 | #133 | Excellent 10.8% |
| New Zealanders | 82.9 /100 | #134 | Excellent 10.8% |
| Brazilians | 82.7 /100 | #135 | Excellent 10.8% |
| Immigrants | Israel | 80.9 /100 | #136 | Excellent 10.8% |
| Immigrants | Switzerland | 79.2 /100 | #137 | Good 10.8% |
| Yugoslavians | 78.2 /100 | #138 | Good 10.8% |
| Immigrants | Jordan | 77.5 /100 | #139 | Good 10.8% |
| Tlingit-Haida | 76.1 /100 | #140 | Good 10.9% |
| Immigrants | France | 75.8 /100 | #141 | Good 10.9% |
| Basques | 74.6 /100 | #142 | Good 10.9% |
Demographics Similar to Cypriots by Male Poverty
In terms of male poverty, the demographic groups most similar to Cypriots are Russian (9.9%, a difference of 0.080%), Immigrants from Pakistan (9.9%, a difference of 0.090%), Korean (9.9%, a difference of 0.10%), Immigrants from Iran (9.9%, a difference of 0.34%), and Immigrants from Greece (9.8%, a difference of 0.46%).
| Demographics | Rating | Rank | Male Poverty |
| Immigrants | Northern Europe | 99.5 /100 | #33 | Exceptional 9.7% |
| Immigrants | Poland | 99.5 /100 | #34 | Exceptional 9.8% |
| Iranians | 99.4 /100 | #35 | Exceptional 9.8% |
| Czechs | 99.4 /100 | #36 | Exceptional 9.8% |
| Immigrants | Greece | 99.3 /100 | #37 | Exceptional 9.8% |
| Immigrants | Pakistan | 99.2 /100 | #38 | Exceptional 9.9% |
| Russians | 99.2 /100 | #39 | Exceptional 9.9% |
| Cypriots | 99.2 /100 | #40 | Exceptional 9.9% |
| Koreans | 99.2 /100 | #41 | Exceptional 9.9% |
| Immigrants | Iran | 99.1 /100 | #42 | Exceptional 9.9% |
| Immigrants | Moldova | 99.0 /100 | #43 | Exceptional 9.9% |
| Immigrants | Romania | 98.9 /100 | #44 | Exceptional 9.9% |
| Immigrants | Serbia | 98.9 /100 | #45 | Exceptional 10.0% |
| Turks | 98.9 /100 | #46 | Exceptional 10.0% |
| Immigrants | Singapore | 98.8 /100 | #47 | Exceptional 10.0% |