Scandinavian vs Cypriot Male Poverty
COMPARE
Scandinavian
Cypriot
Male Poverty
Male Poverty Comparison
Scandinavians
Cypriots
10.1%
MALE POVERTY
98.0/ 100
METRIC RATING
58th/ 347
METRIC RANK
9.9%
MALE POVERTY
99.2/ 100
METRIC RATING
40th/ 347
METRIC RANK
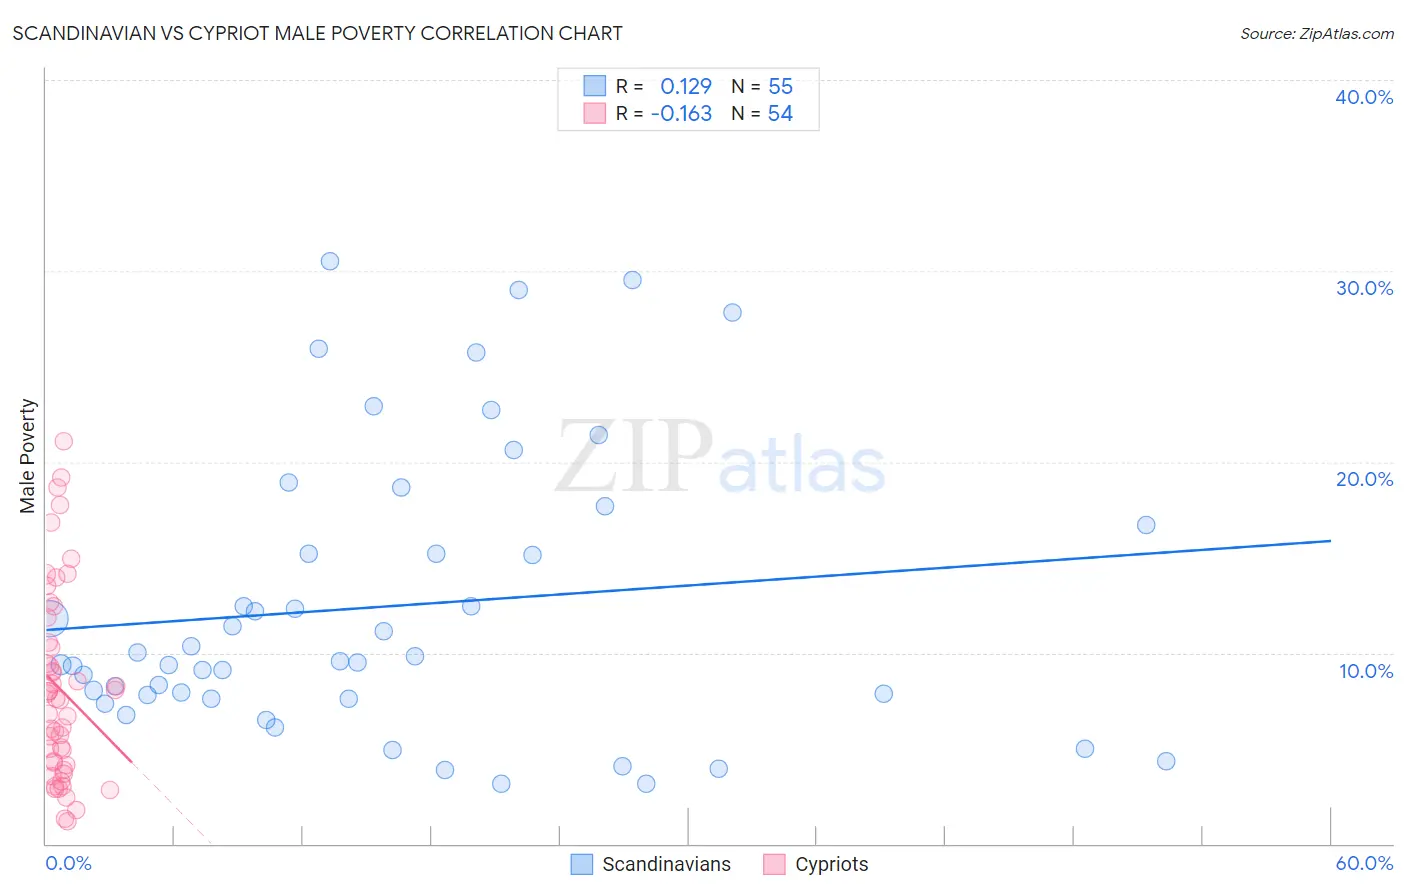
Scandinavian vs Cypriot Male Poverty Correlation Chart
The statistical analysis conducted on geographies consisting of 471,949,294 people shows a poor positive correlation between the proportion of Scandinavians and poverty level among males in the United States with a correlation coefficient (R) of 0.129 and weighted average of 10.1%. Similarly, the statistical analysis conducted on geographies consisting of 61,836,468 people shows a poor negative correlation between the proportion of Cypriots and poverty level among males in the United States with a correlation coefficient (R) of -0.163 and weighted average of 9.9%, a difference of 2.6%.
Male Poverty Correlation Summary
| Measurement | Scandinavian | Cypriot |
| Minimum | 3.2% | 1.2% |
| Maximum | 30.5% | 21.1% |
| Range | 27.3% | 19.9% |
| Mean | 12.4% | 8.1% |
| Median | 9.6% | 7.6% |
| Interquartile 25% (IQ1) | 7.6% | 4.1% |
| Interquartile 75% (IQ3) | 16.7% | 10.5% |
| Interquartile Range (IQR) | 9.0% | 6.4% |
| Standard Deviation (Sample) | 7.4% | 5.0% |
| Standard Deviation (Population) | 7.3% | 4.9% |
Demographics Similar to Scandinavians and Cypriots by Male Poverty
In terms of male poverty, the demographic groups most similar to Scandinavians are Estonian (10.1%, a difference of 0.070%), Immigrants from Europe (10.1%, a difference of 0.13%), Immigrants from Bulgaria (10.1%, a difference of 0.22%), German (10.1%, a difference of 0.42%), and Immigrants from Austria (10.0%, a difference of 0.71%). Similarly, the demographic groups most similar to Cypriots are Russian (9.9%, a difference of 0.080%), Korean (9.9%, a difference of 0.10%), Immigrants from Iran (9.9%, a difference of 0.34%), Immigrants from Moldova (9.9%, a difference of 0.60%), and Immigrants from Romania (9.9%, a difference of 0.82%).
| Demographics | Rating | Rank | Male Poverty |
| Russians | 99.2 /100 | #39 | Exceptional 9.9% |
| Cypriots | 99.2 /100 | #40 | Exceptional 9.9% |
| Koreans | 99.2 /100 | #41 | Exceptional 9.9% |
| Immigrants | Iran | 99.1 /100 | #42 | Exceptional 9.9% |
| Immigrants | Moldova | 99.0 /100 | #43 | Exceptional 9.9% |
| Immigrants | Romania | 98.9 /100 | #44 | Exceptional 9.9% |
| Immigrants | Serbia | 98.9 /100 | #45 | Exceptional 10.0% |
| Turks | 98.9 /100 | #46 | Exceptional 10.0% |
| Immigrants | Singapore | 98.8 /100 | #47 | Exceptional 10.0% |
| Immigrants | Japan | 98.8 /100 | #48 | Exceptional 10.0% |
| Slovenes | 98.8 /100 | #49 | Exceptional 10.0% |
| Immigrants | Philippines | 98.7 /100 | #50 | Exceptional 10.0% |
| Immigrants | Croatia | 98.7 /100 | #51 | Exceptional 10.0% |
| Asians | 98.7 /100 | #52 | Exceptional 10.0% |
| Immigrants | Czechoslovakia | 98.6 /100 | #53 | Exceptional 10.0% |
| Immigrants | Austria | 98.5 /100 | #54 | Exceptional 10.0% |
| Germans | 98.3 /100 | #55 | Exceptional 10.1% |
| Immigrants | Bulgaria | 98.2 /100 | #56 | Exceptional 10.1% |
| Estonians | 98.1 /100 | #57 | Exceptional 10.1% |
| Scandinavians | 98.0 /100 | #58 | Exceptional 10.1% |
| Immigrants | Europe | 97.9 /100 | #59 | Exceptional 10.1% |