Scottish vs Cypriot Male Poverty

COMPARE

Scottish
Race
Ancestry
AfghanAfricanAlaska NativeAlaskan AthabascanAlbanianAleutAlsatianAmericanApacheArabArapahoArgentineanArmenianAssyrian/Chaldean/SyriacAustralianAustrianBahamianBangladeshiBarbadianBasqueBelgianBelizeanBermudanBhutaneseBlackfeetBolivianBrazilianBritishBritish West IndianBulgarianBurmeseCajunCambodianCanadianCape VerdeanCarpatho RusynCelticCentral AmericanCentral American IndianCherokeeCheyenneChickasawChileanChineseChippewaChoctawColombianColvilleComancheCosta RicanCreeCreekCroatianCrowCubanCzechCzechoslovakianDanishDelawareDominicanDutchDutch West IndianEastern EuropeanEcuadorianEgyptianEnglishEstonianEthiopianEuropeanFijianFilipinoFinnishFrenchFrench American IndianFrench CanadianGermanGerman RussianGhanaianGreekGuamanian/ChamorroGuatemalanGuyaneseHaitianHmongHonduranHopiHoumaHungarianIcelanderIndian (Asian)IndonesianInupiatIranianIraqiIrishIroquoisIsraeliItalianJamaicanJapaneseJordanianKenyanKiowaKoreanLaotianLatvianLebaneseLiberianLithuanianLumbeeLuxembourgerMacedonianMalaysianMalteseMarshalleseMenomineeMexicanMexican American IndianMongolianMoroccanNative HawaiianNavajoNepaleseNew ZealanderNicaraguanNigerianNorthern EuropeanNorwegianOkinawanOsageOttawaPaiutePakistaniPalestinianPanamanianParaguayanPennsylvania GermanPeruvianPimaPolishPortuguesePotawatomiPuebloPuerto RicanPuget Sound SalishRomanianRussianSalvadoranSamoanScandinavianScotch-IrishScottishSeminoleSenegaleseSerbianShoshoneSierra LeoneanSiouxSlavicSlovakSloveneSomaliSouth AfricanSouth AmericanSouth American IndianSoviet UnionSpaniardSpanishSpanish AmericanSpanish American IndianSri LankanSubsaharan AfricanSudaneseSwedishSwissSyrianTaiwaneseThaiTlingit-HaidaTohono O'OdhamTonganTrinidadian and TobagonianTsimshianTurkishU.S. Virgin IslanderUgandanUkrainianUruguayanUteVenezuelanVietnameseWelshWest IndianYakamaYaquiYugoslavianYumanYup'ikZimbabwean
Immigration
NonimmigrantsImmigrantsAfghanistanAfricaAlbaniaArgentinaArmeniaAsiaAustraliaAustriaBahamasBangladeshBarbadosBelarusBelgiumBelizeBoliviaBosnia and HerzegovinaBrazilBulgariaBurma/MyanmarCabo VerdeCambodiaCameroonCanadaCaribbeanCentral AmericaChileChinaColombiaCongoCosta RicaCroatiaCubaCzechoslovakiaDenmarkDominicaDominican RepublicEastern AfricaEastern AsiaEastern EuropeEcuadorEgyptEl SalvadorEnglandEritreaEthiopiaEuropeFijiFranceGermanyGhanaGreeceGrenadaGuatemalaGuyanaHaitiHondurasHong KongHungaryIndiaIndonesiaIranIraqIrelandIsraelItalyJamaicaJapanJordanKazakhstanKenyaKoreaKuwaitLaosLatin AmericaLatviaLebanonLiberiaLithuaniaMalaysiaMexicoMicronesiaMiddle AfricaMoldovaMoroccoNepalNetherlandsNicaraguaNigeriaNorth AmericaNorth MacedoniaNorthern AfricaNorthern EuropeNorwayOceaniaPakistanPanamaPeruPhilippinesPolandPortugalRomaniaRussiaSaudi ArabiaScotlandSenegalSerbiaSierra LeoneSingaporeSomaliaSouth AfricaSouth AmericaSouth Central AsiaSouth Eastern AsiaSouthern EuropeSpainSri LankaSt. Vincent and the GrenadinesSudanSwedenSwitzerlandSyriaTaiwanThailandTrinidad and TobagoTurkeyUgandaUkraineUruguayUzbekistanVenezuelaVietnamWest IndiesWestern AfricaWestern AsiaWestern EuropeYemenZaireZimbabweAzores
Cypriot
Race
Ancestry
AfghanAfricanAlaska NativeAlaskan AthabascanAlbanianAleutAlsatianAmericanApacheArabArapahoArgentineanArmenianAssyrian/Chaldean/SyriacAustralianAustrianBahamianBangladeshiBarbadianBasqueBelgianBelizeanBermudanBhutaneseBlackfeetBolivianBrazilianBritishBritish West IndianBulgarianBurmeseCajunCambodianCanadianCape VerdeanCarpatho RusynCelticCentral AmericanCentral American IndianCherokeeCheyenneChickasawChileanChineseChippewaChoctawColombianColvilleComancheCosta RicanCreeCreekCroatianCrowCubanCypriotCzechCzechoslovakianDanishDelawareDominicanDutchDutch West IndianEastern EuropeanEcuadorianEgyptianEnglishEstonianEthiopianEuropeanFijianFilipinoFinnishFrenchFrench American IndianFrench CanadianGermanGerman RussianGhanaianGreekGuamanian/ChamorroGuatemalanGuyaneseHaitianHmongHonduranHopiHoumaHungarianIcelanderIndian (Asian)IndonesianInupiatIranianIraqiIrishIroquoisIsraeliItalianJamaicanJapaneseJordanianKenyanKiowaKoreanLaotianLatvianLebaneseLiberianLithuanianLumbeeLuxembourgerMacedonianMalaysianMalteseMarshalleseMenomineeMexicanMexican American IndianMongolianMoroccanNative HawaiianNavajoNepaleseNew ZealanderNicaraguanNigerianNorthern EuropeanNorwegianOkinawanOsageOttawaPaiutePakistaniPalestinianPanamanianParaguayanPennsylvania GermanPeruvianPimaPolishPortuguesePotawatomiPuebloPuerto RicanPuget Sound SalishRomanianRussianSalvadoranSamoanScandinavianScotch-IrishSeminoleSenegaleseSerbianShoshoneSierra LeoneanSiouxSlavicSlovakSloveneSomaliSouth AfricanSouth AmericanSouth American IndianSoviet UnionSpaniardSpanishSpanish AmericanSpanish American IndianSri LankanSubsaharan AfricanSudaneseSwedishSwissSyrianTaiwaneseThaiTlingit-HaidaTohono O'OdhamTonganTrinidadian and TobagonianTsimshianTurkishU.S. Virgin IslanderUgandanUkrainianUruguayanUteVenezuelanVietnameseWelshWest IndianYakamaYaquiYugoslavianYumanYup'ikZimbabwean
Immigration
NonimmigrantsImmigrantsAfghanistanAfricaAlbaniaArgentinaArmeniaAsiaAustraliaAustriaBahamasBangladeshBarbadosBelarusBelgiumBelizeBoliviaBosnia and HerzegovinaBrazilBulgariaBurma/MyanmarCabo VerdeCambodiaCameroonCanadaCaribbeanCentral AmericaChileChinaColombiaCongoCosta RicaCroatiaCubaCzechoslovakiaDenmarkDominicaDominican RepublicEastern AfricaEastern AsiaEastern EuropeEcuadorEgyptEl SalvadorEnglandEritreaEthiopiaEuropeFijiFranceGermanyGhanaGreeceGrenadaGuatemalaGuyanaHaitiHondurasHong KongHungaryIndiaIndonesiaIranIraqIrelandIsraelItalyJamaicaJapanJordanKazakhstanKenyaKoreaKuwaitLaosLatin AmericaLatviaLebanonLiberiaLithuaniaMalaysiaMexicoMicronesiaMiddle AfricaMoldovaMoroccoNepalNetherlandsNicaraguaNigeriaNorth AmericaNorth MacedoniaNorthern AfricaNorthern EuropeNorwayOceaniaPakistanPanamaPeruPhilippinesPolandPortugalRomaniaRussiaSaudi ArabiaScotlandSenegalSerbiaSierra LeoneSingaporeSomaliaSouth AfricaSouth AmericaSouth Central AsiaSouth Eastern AsiaSouthern EuropeSpainSri LankaSt. Vincent and the GrenadinesSudanSwedenSwitzerlandSyriaTaiwanThailandTrinidad and TobagoTurkeyUgandaUkraineUruguayUzbekistanVenezuelaVietnamWest IndiesWestern AfricaWestern AsiaWestern EuropeYemenZaireZimbabweAzores
Male Poverty
Income
Poverty
Unemployment
Labor Participation
Family Structure
Vehicle Availability
Education Level
Disability

Male Poverty Comparison

Scottish

Cypriots

Exceptional
Exceptional
10.4%
MALE POVERTY
94.0/ 100
METRIC RATING
95th/ 347
METRIC RANK
9.9%
MALE POVERTY
99.2/ 100
METRIC RATING
40th/ 347
METRIC RANK

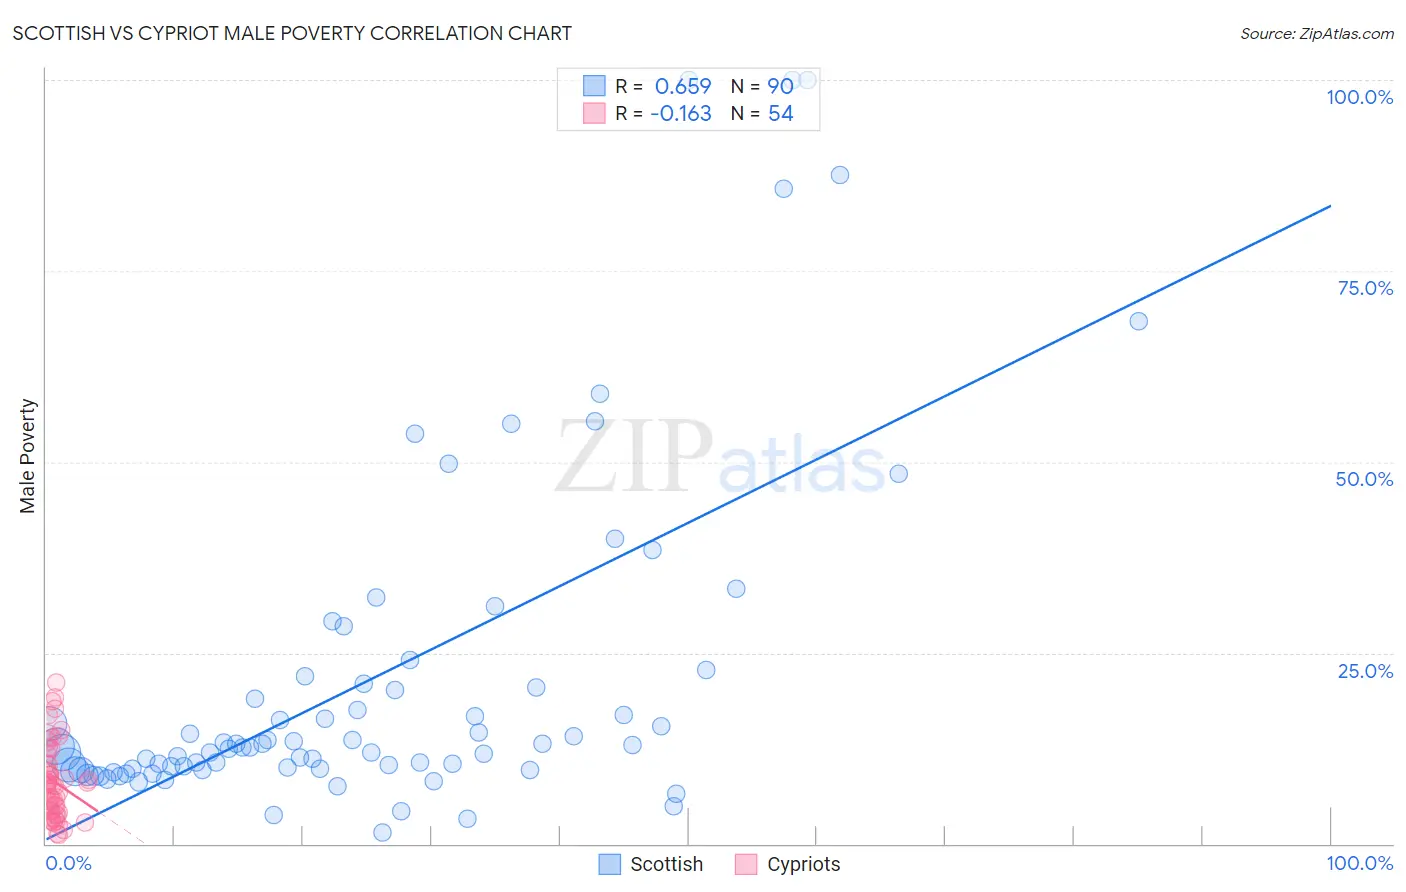
Scottish vs Cypriot Male Poverty Correlation Chart

The statistical analysis conducted on geographies consisting of 565,490,793 people shows a significant positive correlation between the proportion of Scottish and poverty level among males in the United States with a correlation coefficient (R) of 0.659 and weighted average of 10.4%. Similarly, the statistical analysis conducted on geographies consisting of 61,836,468 people shows a poor negative correlation between the proportion of Cypriots and poverty level among males in the United States with a correlation coefficient (R) of -0.163 and weighted average of 9.9%, a difference of 5.8%.
Scottish vs Cypriot Male Poverty

Male Poverty Correlation Summary

MeasurementScottishCypriot
Minimum1.5%1.2%
Maximum100.0%21.1%
Range98.5%19.9%
Mean21.6%8.1%
Median12.7%7.6%
Interquartile 25% (IQ1)9.8%4.1%
Interquartile 75% (IQ3)20.9%10.5%
Interquartile Range (IQR)11.1%6.4%
Standard Deviation (Sample)22.3%5.0%
Standard Deviation (Population)22.2%4.9%

Similar Demographics by Male Poverty

Demographics Similar to Scottish by Male Poverty

In terms of male poverty, the demographic groups most similar to Scottish are Immigrants from South Africa (10.4%, a difference of 0.030%), Immigrants from Egypt (10.4%, a difference of 0.13%), Romanian (10.5%, a difference of 0.18%), Australian (10.4%, a difference of 0.20%), and Jordanian (10.4%, a difference of 0.21%).
DemographicsRating | RankMale Poverty
Cambodians
95.0
/100
|
#88
Exceptional
10.4%
Immigrants | Denmark
95.0
/100
|
#89
Exceptional
10.4%
Indians (Asian)
94.9
/100
|
#90
Exceptional
10.4%
British
94.8
/100
|
#91
Exceptional
10.4%
Jordanians
94.4
/100
|
#92
Exceptional
10.4%
Australians
94.4
/100
|
#93
Exceptional
10.4%
Immigrants | South Africa
94.1
/100
|
#94
Exceptional
10.4%
Scottish
94.0
/100
|
#95
Exceptional
10.4%
Immigrants | Egypt
93.7
/100
|
#96
Exceptional
10.4%
Romanians
93.6
/100
|
#97
Exceptional
10.5%
Finns
93.4
/100
|
#98
Exceptional
10.5%
Immigrants | Indonesia
93.3
/100
|
#99
Exceptional
10.5%
Immigrants | Latvia
92.8
/100
|
#100
Exceptional
10.5%
Immigrants | Zimbabwe
92.0
/100
|
#101
Exceptional
10.5%
French Canadians
91.9
/100
|
#102
Exceptional
10.5%

Demographics Similar to Cypriots by Male Poverty

In terms of male poverty, the demographic groups most similar to Cypriots are Russian (9.9%, a difference of 0.080%), Immigrants from Pakistan (9.9%, a difference of 0.090%), Korean (9.9%, a difference of 0.10%), Immigrants from Iran (9.9%, a difference of 0.34%), and Immigrants from Greece (9.8%, a difference of 0.46%).
DemographicsRating | RankMale Poverty
Immigrants | Northern Europe
99.5
/100
|
#33
Exceptional
9.7%
Immigrants | Poland
99.5
/100
|
#34
Exceptional
9.8%
Iranians
99.4
/100
|
#35
Exceptional
9.8%
Czechs
99.4
/100
|
#36
Exceptional
9.8%
Immigrants | Greece
99.3
/100
|
#37
Exceptional
9.8%
Immigrants | Pakistan
99.2
/100
|
#38
Exceptional
9.9%
Russians
99.2
/100
|
#39
Exceptional
9.9%
Cypriots
99.2
/100
|
#40
Exceptional
9.9%
Koreans
99.2
/100
|
#41
Exceptional
9.9%
Immigrants | Iran
99.1
/100
|
#42
Exceptional
9.9%
Immigrants | Moldova
99.0
/100
|
#43
Exceptional
9.9%
Immigrants | Romania
98.9
/100
|
#44
Exceptional
9.9%
Immigrants | Serbia
98.9
/100
|
#45
Exceptional
10.0%
Turks
98.9
/100
|
#46
Exceptional
10.0%
Immigrants | Singapore
98.8
/100
|
#47
Exceptional
10.0%