Brazilian vs Immigrants from Russia Male Poverty
COMPARE
Brazilian
Immigrants from Russia
Male Poverty
Male Poverty Comparison
Brazilians
Immigrants from Russia
10.8%
MALE POVERTY
82.7/ 100
METRIC RATING
135th/ 347
METRIC RANK
10.6%
MALE POVERTY
88.6/ 100
METRIC RATING
115th/ 347
METRIC RANK
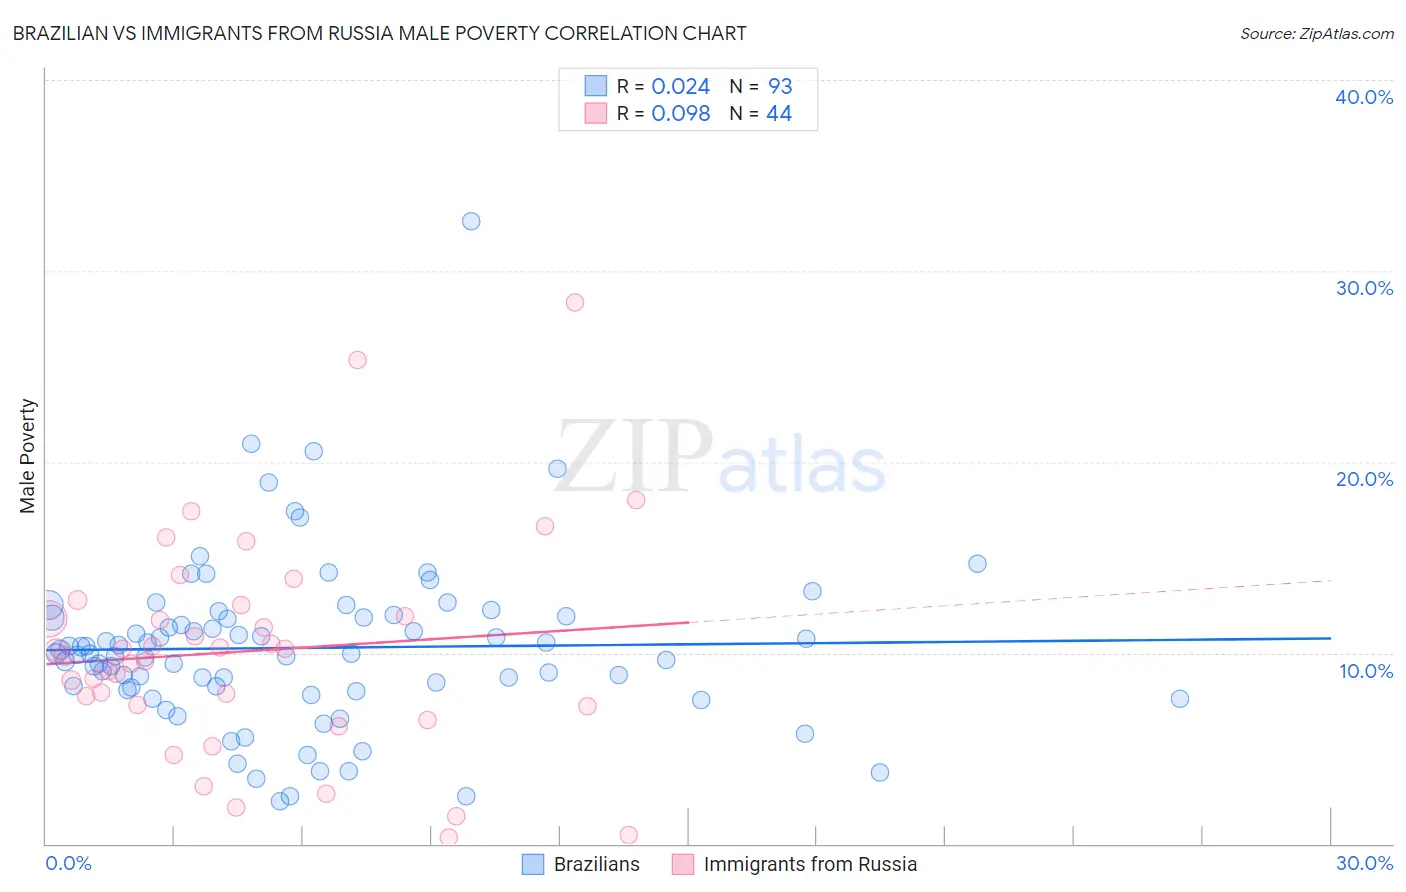
Brazilian vs Immigrants from Russia Male Poverty Correlation Chart
The statistical analysis conducted on geographies consisting of 323,645,938 people shows no correlation between the proportion of Brazilians and poverty level among males in the United States with a correlation coefficient (R) of 0.024 and weighted average of 10.8%. Similarly, the statistical analysis conducted on geographies consisting of 347,573,177 people shows a slight positive correlation between the proportion of Immigrants from Russia and poverty level among males in the United States with a correlation coefficient (R) of 0.098 and weighted average of 10.6%, a difference of 1.2%.
Male Poverty Correlation Summary
| Measurement | Brazilian | Immigrants from Russia |
| Minimum | 2.2% | 0.34% |
| Maximum | 32.6% | 28.4% |
| Range | 30.4% | 28.0% |
| Mean | 10.3% | 10.1% |
| Median | 10.0% | 10.0% |
| Interquartile 25% (IQ1) | 8.1% | 7.2% |
| Interquartile 75% (IQ3) | 11.9% | 12.2% |
| Interquartile Range (IQR) | 3.8% | 5.0% |
| Standard Deviation (Sample) | 4.4% | 5.7% |
| Standard Deviation (Population) | 4.4% | 5.7% |
Demographics Similar to Brazilians and Immigrants from Russia by Male Poverty
In terms of male poverty, the demographic groups most similar to Brazilians are New Zealander (10.8%, a difference of 0.040%), Pakistani (10.8%, a difference of 0.050%), Immigrants from Vietnam (10.8%, a difference of 0.060%), Immigrants from Belarus (10.7%, a difference of 0.11%), and Chilean (10.7%, a difference of 0.22%). Similarly, the demographic groups most similar to Immigrants from Russia are Sri Lankan (10.6%, a difference of 0.11%), Immigrants from South Eastern Asia (10.6%, a difference of 0.13%), Okinawan (10.7%, a difference of 0.24%), Immigrants from Hungary (10.7%, a difference of 0.24%), and Immigrants from China (10.7%, a difference of 0.34%).
| Demographics | Rating | Rank | Male Poverty |
| Immigrants | Russia | 88.6 /100 | #115 | Excellent 10.6% |
| Sri Lankans | 88.1 /100 | #116 | Excellent 10.6% |
| Immigrants | South Eastern Asia | 88.1 /100 | #117 | Excellent 10.6% |
| Okinawans | 87.6 /100 | #118 | Excellent 10.7% |
| Immigrants | Hungary | 87.6 /100 | #119 | Excellent 10.7% |
| Immigrants | China | 87.1 /100 | #120 | Excellent 10.7% |
| Peruvians | 87.1 /100 | #121 | Excellent 10.7% |
| Native Hawaiians | 87.0 /100 | #122 | Excellent 10.7% |
| South Africans | 86.8 /100 | #123 | Excellent 10.7% |
| French | 86.7 /100 | #124 | Excellent 10.7% |
| Immigrants | Norway | 86.0 /100 | #125 | Excellent 10.7% |
| Immigrants | Ukraine | 84.3 /100 | #126 | Excellent 10.7% |
| Puget Sound Salish | 84.3 /100 | #127 | Excellent 10.7% |
| Immigrants | Western Europe | 84.2 /100 | #128 | Excellent 10.7% |
| Immigrants | Peru | 84.1 /100 | #129 | Excellent 10.7% |
| Chileans | 83.9 /100 | #130 | Excellent 10.7% |
| Immigrants | Belarus | 83.3 /100 | #131 | Excellent 10.7% |
| Immigrants | Vietnam | 83.0 /100 | #132 | Excellent 10.8% |
| Pakistanis | 83.0 /100 | #133 | Excellent 10.8% |
| New Zealanders | 82.9 /100 | #134 | Excellent 10.8% |
| Brazilians | 82.7 /100 | #135 | Excellent 10.8% |