Brazilian vs Nigerian Male Poverty
COMPARE
Brazilian
Nigerian
Male Poverty
Male Poverty Comparison
Brazilians
Nigerians
10.8%
MALE POVERTY
82.7/ 100
METRIC RATING
135th/ 347
METRIC RANK
12.3%
MALE POVERTY
1.4/ 100
METRIC RATING
226th/ 347
METRIC RANK
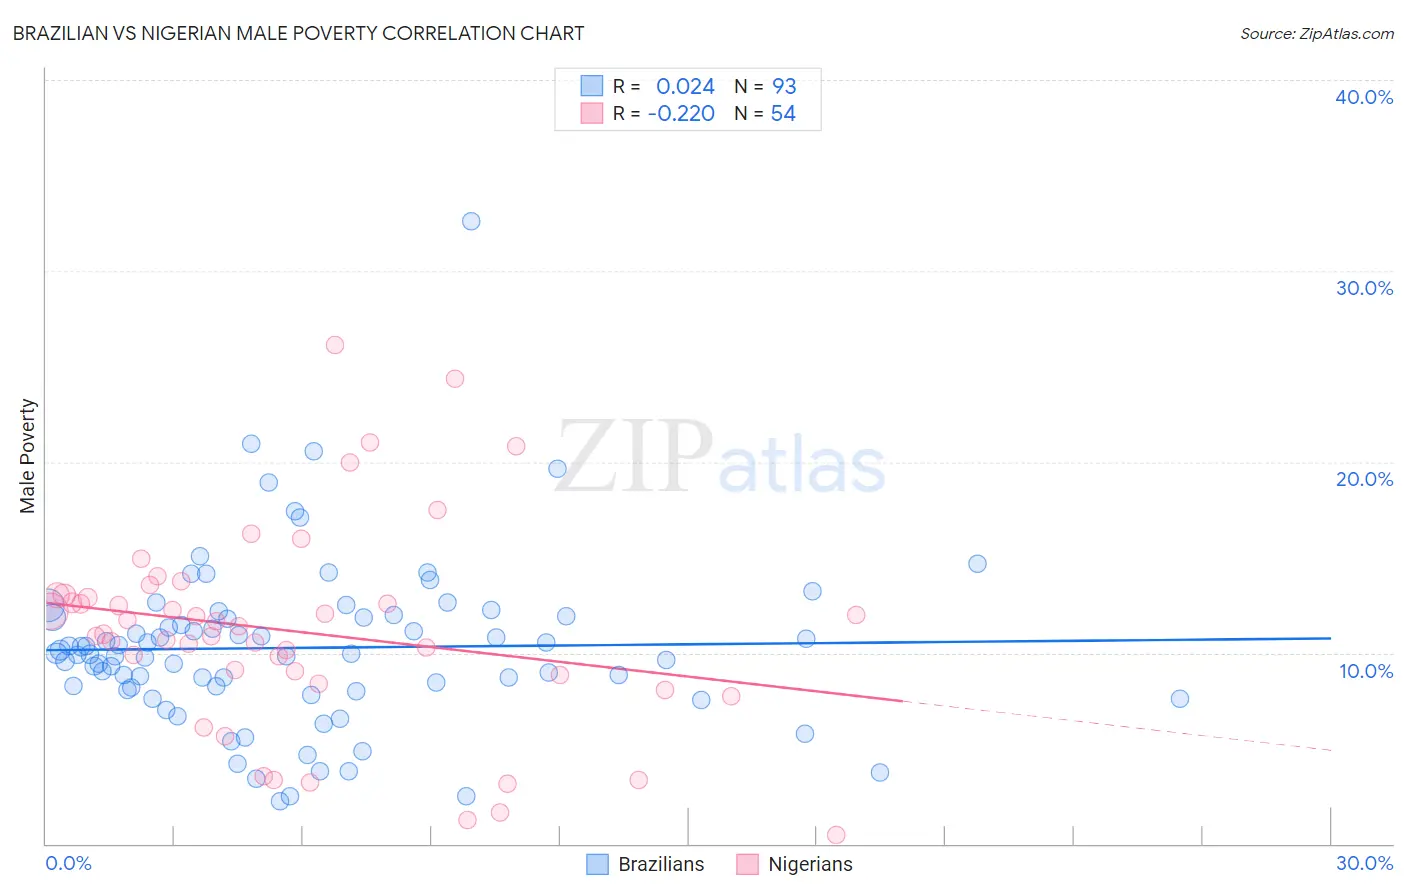
Brazilian vs Nigerian Male Poverty Correlation Chart
The statistical analysis conducted on geographies consisting of 323,645,938 people shows no correlation between the proportion of Brazilians and poverty level among males in the United States with a correlation coefficient (R) of 0.024 and weighted average of 10.8%. Similarly, the statistical analysis conducted on geographies consisting of 332,422,951 people shows a weak negative correlation between the proportion of Nigerians and poverty level among males in the United States with a correlation coefficient (R) of -0.220 and weighted average of 12.3%, a difference of 14.8%.
Male Poverty Correlation Summary
| Measurement | Brazilian | Nigerian |
| Minimum | 2.2% | 0.49% |
| Maximum | 32.6% | 26.1% |
| Range | 30.4% | 25.6% |
| Mean | 10.3% | 11.1% |
| Median | 10.0% | 11.2% |
| Interquartile 25% (IQ1) | 8.1% | 8.9% |
| Interquartile 75% (IQ3) | 11.9% | 13.0% |
| Interquartile Range (IQR) | 3.8% | 4.1% |
| Standard Deviation (Sample) | 4.4% | 5.4% |
| Standard Deviation (Population) | 4.4% | 5.3% |
Similar Demographics by Male Poverty
Demographics Similar to Brazilians by Male Poverty
In terms of male poverty, the demographic groups most similar to Brazilians are New Zealander (10.8%, a difference of 0.040%), Pakistani (10.8%, a difference of 0.050%), Immigrants from Vietnam (10.8%, a difference of 0.060%), Immigrants from Belarus (10.7%, a difference of 0.11%), and Chilean (10.7%, a difference of 0.22%).
| Demographics | Rating | Rank | Male Poverty |
| Immigrants | Western Europe | 84.2 /100 | #128 | Excellent 10.7% |
| Immigrants | Peru | 84.1 /100 | #129 | Excellent 10.7% |
| Chileans | 83.9 /100 | #130 | Excellent 10.7% |
| Immigrants | Belarus | 83.3 /100 | #131 | Excellent 10.7% |
| Immigrants | Vietnam | 83.0 /100 | #132 | Excellent 10.8% |
| Pakistanis | 83.0 /100 | #133 | Excellent 10.8% |
| New Zealanders | 82.9 /100 | #134 | Excellent 10.8% |
| Brazilians | 82.7 /100 | #135 | Excellent 10.8% |
| Immigrants | Israel | 80.9 /100 | #136 | Excellent 10.8% |
| Immigrants | Switzerland | 79.2 /100 | #137 | Good 10.8% |
| Yugoslavians | 78.2 /100 | #138 | Good 10.8% |
| Immigrants | Jordan | 77.5 /100 | #139 | Good 10.8% |
| Tlingit-Haida | 76.1 /100 | #140 | Good 10.9% |
| Immigrants | France | 75.8 /100 | #141 | Good 10.9% |
| Basques | 74.6 /100 | #142 | Good 10.9% |
Demographics Similar to Nigerians by Male Poverty
In terms of male poverty, the demographic groups most similar to Nigerians are Alaska Native (12.4%, a difference of 0.090%), Alsatian (12.4%, a difference of 0.13%), Osage (12.3%, a difference of 0.17%), Immigrants from Nigeria (12.3%, a difference of 0.22%), and Cuban (12.4%, a difference of 0.23%).
| Demographics | Rating | Rank | Male Poverty |
| Bermudans | 2.4 /100 | #219 | Tragic 12.2% |
| Immigrants | Eritrea | 2.4 /100 | #220 | Tragic 12.2% |
| Ugandans | 2.2 /100 | #221 | Tragic 12.2% |
| Immigrants | Africa | 2.1 /100 | #222 | Tragic 12.2% |
| Immigrants | Micronesia | 2.1 /100 | #223 | Tragic 12.2% |
| Immigrants | Nigeria | 1.6 /100 | #224 | Tragic 12.3% |
| Osage | 1.5 /100 | #225 | Tragic 12.3% |
| Nigerians | 1.4 /100 | #226 | Tragic 12.3% |
| Alaska Natives | 1.4 /100 | #227 | Tragic 12.4% |
| Alsatians | 1.3 /100 | #228 | Tragic 12.4% |
| Cubans | 1.3 /100 | #229 | Tragic 12.4% |
| Marshallese | 0.8 /100 | #230 | Tragic 12.5% |
| Salvadorans | 0.6 /100 | #231 | Tragic 12.6% |
| Nicaraguans | 0.6 /100 | #232 | Tragic 12.6% |
| Fijians | 0.6 /100 | #233 | Tragic 12.6% |