Bolivian vs Scotch-Irish Female Poverty
COMPARE
Bolivian
Scotch-Irish
Female Poverty
Female Poverty Comparison
Bolivians
Scotch-Irish
11.5%
FEMALE POVERTY
99.8/ 100
METRIC RATING
17th/ 347
METRIC RANK
13.3%
FEMALE POVERTY
62.1/ 100
METRIC RATING
165th/ 347
METRIC RANK
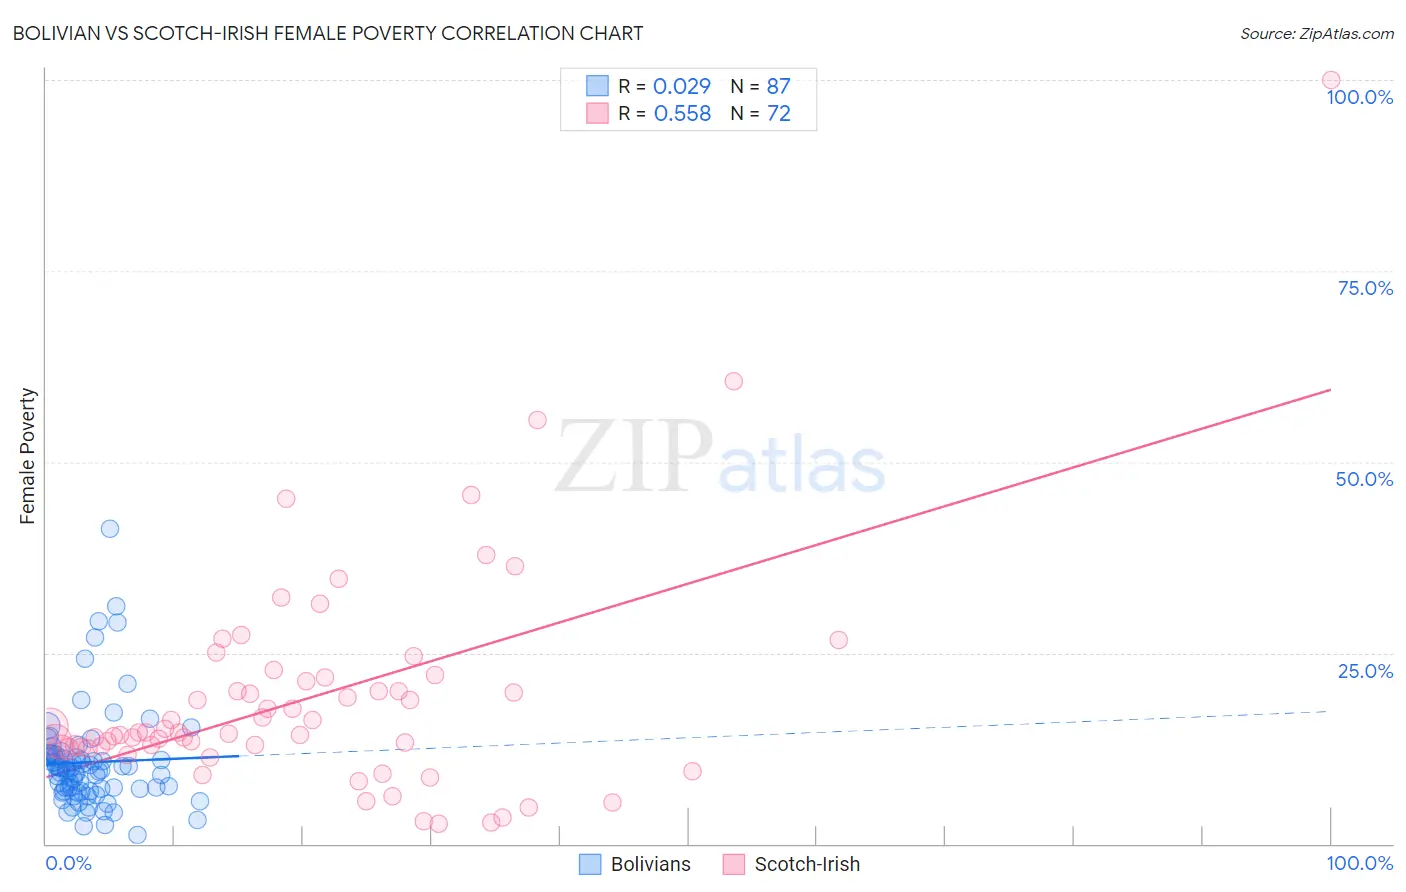
Bolivian vs Scotch-Irish Female Poverty Correlation Chart
The statistical analysis conducted on geographies consisting of 184,615,505 people shows no correlation between the proportion of Bolivians and poverty level among females in the United States with a correlation coefficient (R) of 0.029 and weighted average of 11.5%. Similarly, the statistical analysis conducted on geographies consisting of 547,935,242 people shows a substantial positive correlation between the proportion of Scotch-Irish and poverty level among females in the United States with a correlation coefficient (R) of 0.558 and weighted average of 13.3%, a difference of 15.6%.
Female Poverty Correlation Summary
| Measurement | Bolivian | Scotch-Irish |
| Minimum | 1.1% | 2.6% |
| Maximum | 41.2% | 100.0% |
| Range | 40.1% | 97.4% |
| Mean | 10.7% | 19.2% |
| Median | 9.7% | 14.6% |
| Interquartile 25% (IQ1) | 6.9% | 12.6% |
| Interquartile 75% (IQ3) | 11.6% | 21.5% |
| Interquartile Range (IQR) | 4.7% | 8.8% |
| Standard Deviation (Sample) | 6.6% | 14.9% |
| Standard Deviation (Population) | 6.5% | 14.8% |
Similar Demographics by Female Poverty
Demographics Similar to Bolivians by Female Poverty
In terms of female poverty, the demographic groups most similar to Bolivians are Immigrants from Scotland (11.5%, a difference of 0.050%), Immigrants from Bolivia (11.5%, a difference of 0.070%), Norwegian (11.5%, a difference of 0.090%), Eastern European (11.5%, a difference of 0.32%), and Latvian (11.4%, a difference of 0.54%).
| Demographics | Rating | Rank | Female Poverty |
| Immigrants | Hong Kong | 99.9 /100 | #10 | Exceptional 11.2% |
| Maltese | 99.9 /100 | #11 | Exceptional 11.2% |
| Bhutanese | 99.9 /100 | #12 | Exceptional 11.3% |
| Immigrants | Lithuania | 99.9 /100 | #13 | Exceptional 11.3% |
| Lithuanians | 99.8 /100 | #14 | Exceptional 11.4% |
| Latvians | 99.8 /100 | #15 | Exceptional 11.4% |
| Immigrants | Bolivia | 99.8 /100 | #16 | Exceptional 11.5% |
| Bolivians | 99.8 /100 | #17 | Exceptional 11.5% |
| Immigrants | Scotland | 99.8 /100 | #18 | Exceptional 11.5% |
| Norwegians | 99.8 /100 | #19 | Exceptional 11.5% |
| Eastern Europeans | 99.7 /100 | #20 | Exceptional 11.5% |
| Italians | 99.7 /100 | #21 | Exceptional 11.6% |
| Swedes | 99.7 /100 | #22 | Exceptional 11.6% |
| Burmese | 99.7 /100 | #23 | Exceptional 11.6% |
| Luxembourgers | 99.7 /100 | #24 | Exceptional 11.6% |
Demographics Similar to Scotch-Irish by Female Poverty
In terms of female poverty, the demographic groups most similar to Scotch-Irish are Ethiopian (13.3%, a difference of 0.020%), Guamanian/Chamorro (13.3%, a difference of 0.030%), Immigrants from Albania (13.3%, a difference of 0.030%), Immigrants from Ethiopia (13.3%, a difference of 0.040%), and Immigrants from Nepal (13.3%, a difference of 0.070%).
| Demographics | Rating | Rank | Female Poverty |
| Pennsylvania Germans | 67.3 /100 | #158 | Good 13.2% |
| Costa Ricans | 63.6 /100 | #159 | Good 13.3% |
| Immigrants | Nepal | 62.7 /100 | #160 | Good 13.3% |
| Immigrants | Ethiopia | 62.5 /100 | #161 | Good 13.3% |
| Guamanians/Chamorros | 62.4 /100 | #162 | Good 13.3% |
| Immigrants | Albania | 62.4 /100 | #163 | Good 13.3% |
| Ethiopians | 62.3 /100 | #164 | Good 13.3% |
| Scotch-Irish | 62.1 /100 | #165 | Good 13.3% |
| Immigrants | Oceania | 59.7 /100 | #166 | Average 13.3% |
| Immigrants | Chile | 57.4 /100 | #167 | Average 13.3% |
| Aleuts | 56.7 /100 | #168 | Average 13.4% |
| Lebanese | 55.9 /100 | #169 | Average 13.4% |
| Colombians | 55.7 /100 | #170 | Average 13.4% |
| Whites/Caucasians | 54.6 /100 | #171 | Average 13.4% |
| Mongolians | 53.6 /100 | #172 | Average 13.4% |