Pennsylvania German vs Scotch-Irish Female Poverty
COMPARE
Pennsylvania German
Scotch-Irish
Female Poverty
Female Poverty Comparison
Pennsylvania Germans
Scotch-Irish
13.2%
FEMALE POVERTY
67.3/ 100
METRIC RATING
158th/ 347
METRIC RANK
13.3%
FEMALE POVERTY
62.1/ 100
METRIC RATING
165th/ 347
METRIC RANK
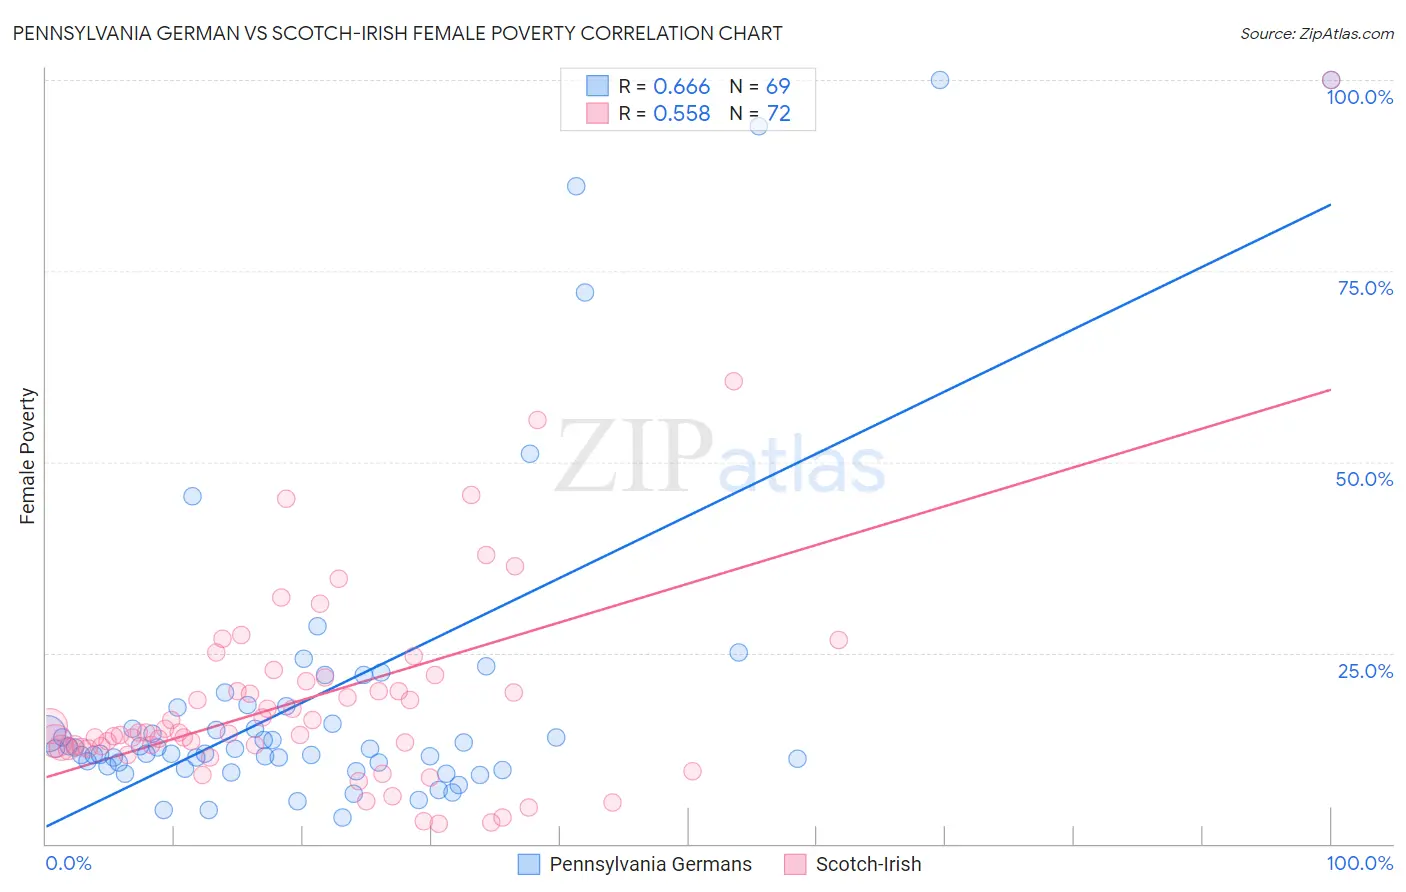
Pennsylvania German vs Scotch-Irish Female Poverty Correlation Chart
The statistical analysis conducted on geographies consisting of 233,998,353 people shows a significant positive correlation between the proportion of Pennsylvania Germans and poverty level among females in the United States with a correlation coefficient (R) of 0.666 and weighted average of 13.2%. Similarly, the statistical analysis conducted on geographies consisting of 547,935,242 people shows a substantial positive correlation between the proportion of Scotch-Irish and poverty level among females in the United States with a correlation coefficient (R) of 0.558 and weighted average of 13.3%, a difference of 0.56%.
Female Poverty Correlation Summary
| Measurement | Pennsylvania German | Scotch-Irish |
| Minimum | 3.4% | 2.6% |
| Maximum | 100.0% | 100.0% |
| Range | 96.6% | 97.4% |
| Mean | 19.5% | 19.2% |
| Median | 12.4% | 14.6% |
| Interquartile 25% (IQ1) | 10.4% | 12.6% |
| Interquartile 75% (IQ3) | 17.9% | 21.5% |
| Interquartile Range (IQR) | 7.5% | 8.8% |
| Standard Deviation (Sample) | 21.6% | 14.9% |
| Standard Deviation (Population) | 21.5% | 14.8% |
Demographics Similar to Pennsylvania Germans and Scotch-Irish by Female Poverty
In terms of female poverty, the demographic groups most similar to Pennsylvania Germans are Immigrants from Northern Africa (13.2%, a difference of 0.17%), Immigrants from Bosnia and Herzegovina (13.2%, a difference of 0.27%), Hungarian (13.2%, a difference of 0.32%), Armenian (13.2%, a difference of 0.36%), and Costa Rican (13.3%, a difference of 0.41%). Similarly, the demographic groups most similar to Scotch-Irish are Ethiopian (13.3%, a difference of 0.020%), Guamanian/Chamorro (13.3%, a difference of 0.030%), Immigrants from Albania (13.3%, a difference of 0.030%), Immigrants from Ethiopia (13.3%, a difference of 0.040%), and Immigrants from Nepal (13.3%, a difference of 0.070%).
| Demographics | Rating | Rank | Female Poverty |
| Immigrants | Germany | 74.9 /100 | #151 | Good 13.1% |
| Samoans | 73.6 /100 | #152 | Good 13.1% |
| Immigrants | Fiji | 71.0 /100 | #153 | Good 13.2% |
| Armenians | 70.4 /100 | #154 | Good 13.2% |
| Hungarians | 70.1 /100 | #155 | Good 13.2% |
| Immigrants | Bosnia and Herzegovina | 69.7 /100 | #156 | Good 13.2% |
| Immigrants | Northern Africa | 68.8 /100 | #157 | Good 13.2% |
| Pennsylvania Germans | 67.3 /100 | #158 | Good 13.2% |
| Costa Ricans | 63.6 /100 | #159 | Good 13.3% |
| Immigrants | Nepal | 62.7 /100 | #160 | Good 13.3% |
| Immigrants | Ethiopia | 62.5 /100 | #161 | Good 13.3% |
| Guamanians/Chamorros | 62.4 /100 | #162 | Good 13.3% |
| Immigrants | Albania | 62.4 /100 | #163 | Good 13.3% |
| Ethiopians | 62.3 /100 | #164 | Good 13.3% |
| Scotch-Irish | 62.1 /100 | #165 | Good 13.3% |
| Immigrants | Oceania | 59.7 /100 | #166 | Average 13.3% |
| Immigrants | Chile | 57.4 /100 | #167 | Average 13.3% |
| Aleuts | 56.7 /100 | #168 | Average 13.4% |
| Lebanese | 55.9 /100 | #169 | Average 13.4% |
| Colombians | 55.7 /100 | #170 | Average 13.4% |
| Whites/Caucasians | 54.6 /100 | #171 | Average 13.4% |