Bolivian vs Haitian Female Poverty
COMPARE
Bolivian
Haitian
Female Poverty
Female Poverty Comparison
Bolivians
Haitians
11.5%
FEMALE POVERTY
99.8/ 100
METRIC RATING
17th/ 347
METRIC RANK
15.9%
FEMALE POVERTY
0.0/ 100
METRIC RATING
273rd/ 347
METRIC RANK
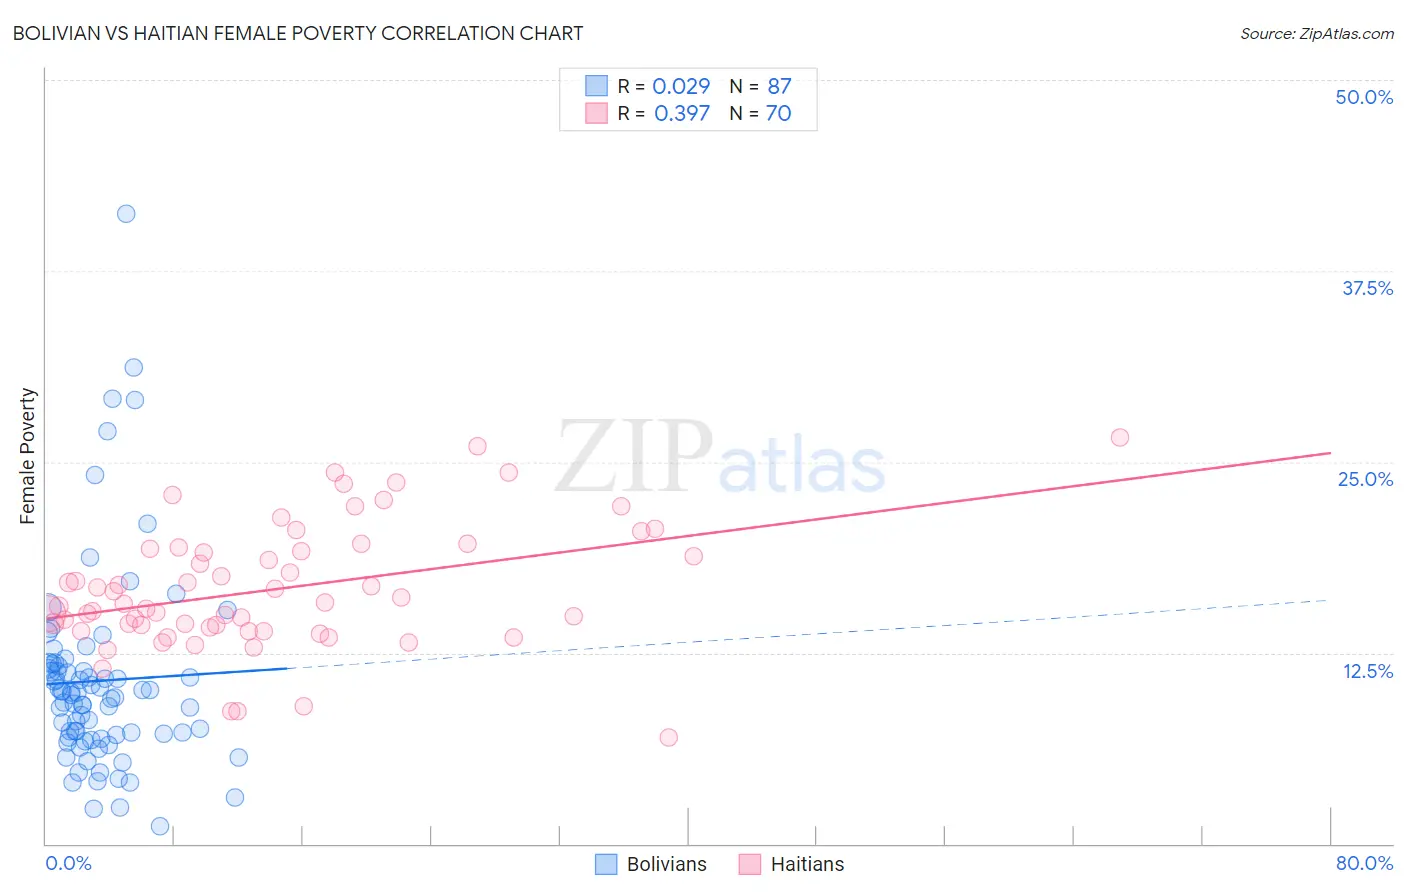
Bolivian vs Haitian Female Poverty Correlation Chart
The statistical analysis conducted on geographies consisting of 184,615,505 people shows no correlation between the proportion of Bolivians and poverty level among females in the United States with a correlation coefficient (R) of 0.029 and weighted average of 11.5%. Similarly, the statistical analysis conducted on geographies consisting of 287,638,574 people shows a mild positive correlation between the proportion of Haitians and poverty level among females in the United States with a correlation coefficient (R) of 0.397 and weighted average of 15.9%, a difference of 38.7%.
Female Poverty Correlation Summary
| Measurement | Bolivian | Haitian |
| Minimum | 1.1% | 6.9% |
| Maximum | 41.2% | 26.6% |
| Range | 40.1% | 19.6% |
| Mean | 10.7% | 16.7% |
| Median | 9.7% | 15.8% |
| Interquartile 25% (IQ1) | 6.9% | 14.1% |
| Interquartile 75% (IQ3) | 11.6% | 19.3% |
| Interquartile Range (IQR) | 4.7% | 5.2% |
| Standard Deviation (Sample) | 6.6% | 4.1% |
| Standard Deviation (Population) | 6.5% | 4.1% |
Similar Demographics by Female Poverty
Demographics Similar to Bolivians by Female Poverty
In terms of female poverty, the demographic groups most similar to Bolivians are Immigrants from Scotland (11.5%, a difference of 0.050%), Immigrants from Bolivia (11.5%, a difference of 0.070%), Norwegian (11.5%, a difference of 0.090%), Eastern European (11.5%, a difference of 0.32%), and Latvian (11.4%, a difference of 0.54%).
| Demographics | Rating | Rank | Female Poverty |
| Immigrants | Hong Kong | 99.9 /100 | #10 | Exceptional 11.2% |
| Maltese | 99.9 /100 | #11 | Exceptional 11.2% |
| Bhutanese | 99.9 /100 | #12 | Exceptional 11.3% |
| Immigrants | Lithuania | 99.9 /100 | #13 | Exceptional 11.3% |
| Lithuanians | 99.8 /100 | #14 | Exceptional 11.4% |
| Latvians | 99.8 /100 | #15 | Exceptional 11.4% |
| Immigrants | Bolivia | 99.8 /100 | #16 | Exceptional 11.5% |
| Bolivians | 99.8 /100 | #17 | Exceptional 11.5% |
| Immigrants | Scotland | 99.8 /100 | #18 | Exceptional 11.5% |
| Norwegians | 99.8 /100 | #19 | Exceptional 11.5% |
| Eastern Europeans | 99.7 /100 | #20 | Exceptional 11.5% |
| Italians | 99.7 /100 | #21 | Exceptional 11.6% |
| Swedes | 99.7 /100 | #22 | Exceptional 11.6% |
| Burmese | 99.7 /100 | #23 | Exceptional 11.6% |
| Luxembourgers | 99.7 /100 | #24 | Exceptional 11.6% |
Demographics Similar to Haitians by Female Poverty
In terms of female poverty, the demographic groups most similar to Haitians are Belizean (15.9%, a difference of 0.0%), Barbadian (15.9%, a difference of 0.0%), Immigrants from Barbados (16.0%, a difference of 0.070%), Central American (16.0%, a difference of 0.20%), and Immigrants from St. Vincent and the Grenadines (15.9%, a difference of 0.23%).
| Demographics | Rating | Rank | Female Poverty |
| Immigrants | El Salvador | 0.1 /100 | #266 | Tragic 15.7% |
| Sub-Saharan Africans | 0.1 /100 | #267 | Tragic 15.8% |
| Immigrants | Nicaragua | 0.1 /100 | #268 | Tragic 15.8% |
| Iroquois | 0.1 /100 | #269 | Tragic 15.8% |
| Chickasaw | 0.1 /100 | #270 | Tragic 15.9% |
| Immigrants | St. Vincent and the Grenadines | 0.0 /100 | #271 | Tragic 15.9% |
| Belizeans | 0.0 /100 | #272 | Tragic 15.9% |
| Haitians | 0.0 /100 | #273 | Tragic 15.9% |
| Barbadians | 0.0 /100 | #274 | Tragic 15.9% |
| Immigrants | Barbados | 0.0 /100 | #275 | Tragic 16.0% |
| Central Americans | 0.0 /100 | #276 | Tragic 16.0% |
| Bangladeshis | 0.0 /100 | #277 | Tragic 16.0% |
| Immigrants | West Indies | 0.0 /100 | #278 | Tragic 16.1% |
| Immigrants | Bahamas | 0.0 /100 | #279 | Tragic 16.1% |
| Vietnamese | 0.0 /100 | #280 | Tragic 16.1% |