Black/African American vs Albanian Male Poverty
COMPARE
Black/African American
Albanian
Male Poverty
Male Poverty Comparison
Blacks/African Americans
Albanians
15.8%
MALE POVERTY
0.0/ 100
METRIC RATING
328th/ 347
METRIC RANK
10.6%
MALE POVERTY
90.6/ 100
METRIC RATING
109th/ 347
METRIC RANK
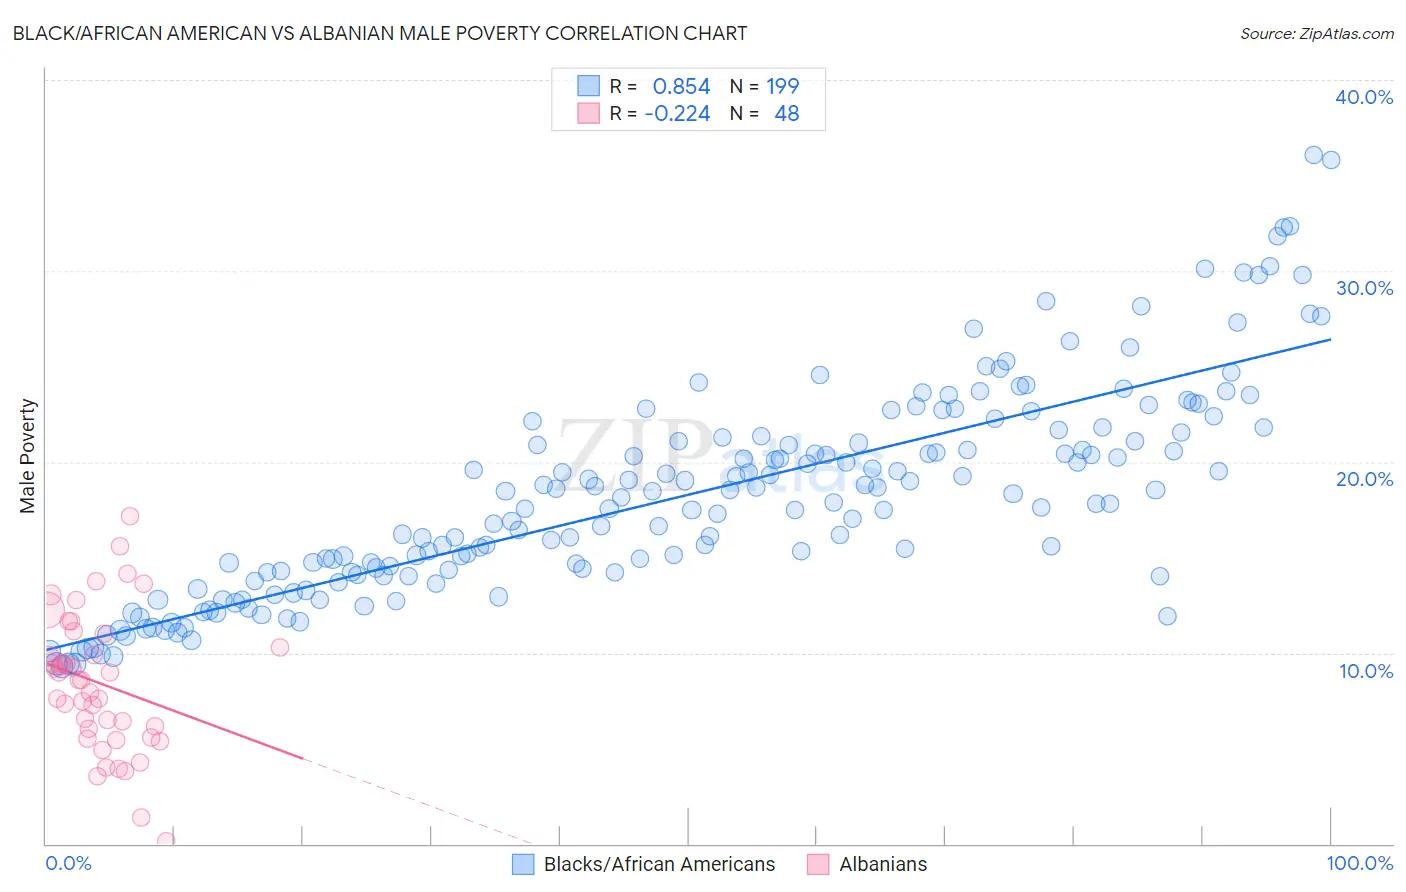
Black/African American vs Albanian Male Poverty Correlation Chart
The statistical analysis conducted on geographies consisting of 564,646,557 people shows a very strong positive correlation between the proportion of Blacks/African Americans and poverty level among males in the United States with a correlation coefficient (R) of 0.854 and weighted average of 15.8%. Similarly, the statistical analysis conducted on geographies consisting of 193,144,677 people shows a weak negative correlation between the proportion of Albanians and poverty level among males in the United States with a correlation coefficient (R) of -0.224 and weighted average of 10.6%, a difference of 49.6%.
Male Poverty Correlation Summary
| Measurement | Black/African American | Albanian |
| Minimum | 9.3% | 0.15% |
| Maximum | 36.0% | 17.1% |
| Range | 26.8% | 17.0% |
| Mean | 18.2% | 8.4% |
| Median | 17.9% | 8.6% |
| Interquartile 25% (IQ1) | 14.2% | 5.8% |
| Interquartile 75% (IQ3) | 21.3% | 10.6% |
| Interquartile Range (IQR) | 7.1% | 4.8% |
| Standard Deviation (Sample) | 5.5% | 3.6% |
| Standard Deviation (Population) | 5.5% | 3.6% |
Similar Demographics by Male Poverty
Demographics Similar to Blacks/African Americans by Male Poverty
In terms of male poverty, the demographic groups most similar to Blacks/African Americans are Paiute (15.8%, a difference of 0.060%), Dominican (16.1%, a difference of 1.7%), Immigrants from Dominican Republic (16.2%, a difference of 2.4%), Ute (16.2%, a difference of 2.7%), and Central American Indian (15.3%, a difference of 3.2%).
| Demographics | Rating | Rank | Male Poverty |
| Arapaho | 0.0 /100 | #321 | Tragic 15.1% |
| Kiowa | 0.0 /100 | #322 | Tragic 15.2% |
| Colville | 0.0 /100 | #323 | Tragic 15.2% |
| Menominee | 0.0 /100 | #324 | Tragic 15.3% |
| Yakama | 0.0 /100 | #325 | Tragic 15.3% |
| Central American Indians | 0.0 /100 | #326 | Tragic 15.3% |
| Paiute | 0.0 /100 | #327 | Tragic 15.8% |
| Blacks/African Americans | 0.0 /100 | #328 | Tragic 15.8% |
| Dominicans | 0.0 /100 | #329 | Tragic 16.1% |
| Immigrants | Dominican Republic | 0.0 /100 | #330 | Tragic 16.2% |
| Ute | 0.0 /100 | #331 | Tragic 16.2% |
| Houma | 0.0 /100 | #332 | Tragic 16.7% |
| Natives/Alaskans | 0.0 /100 | #333 | Tragic 16.9% |
| Cheyenne | 0.0 /100 | #334 | Tragic 17.6% |
| Apache | 0.0 /100 | #335 | Tragic 17.7% |
Demographics Similar to Albanians by Male Poverty
In terms of male poverty, the demographic groups most similar to Albanians are Portuguese (10.6%, a difference of 0.13%), Argentinean (10.6%, a difference of 0.13%), Immigrants from Southern Europe (10.5%, a difference of 0.21%), Laotian (10.5%, a difference of 0.21%), and Immigrants from Argentina (10.6%, a difference of 0.24%).
| Demographics | Rating | Rank | Male Poverty |
| French Canadians | 91.9 /100 | #102 | Exceptional 10.5% |
| Slavs | 91.7 /100 | #103 | Exceptional 10.5% |
| Welsh | 91.6 /100 | #104 | Exceptional 10.5% |
| Canadians | 91.6 /100 | #105 | Exceptional 10.5% |
| Immigrants | Southern Europe | 91.3 /100 | #106 | Exceptional 10.5% |
| Laotians | 91.2 /100 | #107 | Exceptional 10.5% |
| Portuguese | 91.0 /100 | #108 | Exceptional 10.6% |
| Albanians | 90.6 /100 | #109 | Exceptional 10.6% |
| Argentineans | 90.1 /100 | #110 | Exceptional 10.6% |
| Immigrants | Argentina | 89.8 /100 | #111 | Excellent 10.6% |
| Immigrants | Turkey | 89.5 /100 | #112 | Excellent 10.6% |
| Palestinians | 89.1 /100 | #113 | Excellent 10.6% |
| Immigrants | Brazil | 89.0 /100 | #114 | Excellent 10.6% |
| Immigrants | Russia | 88.6 /100 | #115 | Excellent 10.6% |
| Sri Lankans | 88.1 /100 | #116 | Excellent 10.6% |